
[ Archive ]

|
ASPB and CIMSS Weekly Report
[ Archive ] |
|
IN THE PRESS:
ITEMS FOR THE ADMINISTRATOR:
ITEMS FOR THE ASSISTANT ADMINISTRATOR:
ITEMS FOR THE OFFICE DIRECTOR, STAR:
Satellite Data Compression Presentation at the CCSDS 2008 Spring Technical Meeting: Bormin
Huang of the Cooperative Institute for Meteorological Satellite Studies
(CIMSS) attended the Consultative Committee for Space Data Systems
(CCSDS) 2008 Spring Technical Meeting, hosted by NASA in Crystal City,
VA, March 11-13, 2008. Invited by the CCSDS (http://www.ccsds.org)
Multispectral & Hyperspectral Data Compression (MHDC) working group
(WG) chair Aaron Kiely (NASA JPL), Bormin Huang gave a 3-hour talk on
"Current Status of Hyperspectral Imager and Ultraspectral Sounder Data
Compression". His talk reflects recent advances in this research area,
conducted by the CIMSS satellite data compression team in support of
the NOAA next-generation advanced weather satellite data compression
studies (NOAA co-leads are Roger Heymann of OSD and Timothy Schmit of
STAR). Per the CCSDS MHDC WG's request, Bormin Huang selected 20
published papers and 1 book chapter for their collection and reference.
Raffaele Vitulli, the European Space Agency (ESA) delegate to CCSDS
MHDC WG and Chair of ESA On-Board Payload Data Compression Workshop
(OBPDC), invited Bormin Huang to attend the 2008 ESA OBPDC, Noorwijk,
the Netherlands, June 26-27 (http://www.congrex.nl/08c20/). (B. Huang, CIMSS, 608-265-2231)
ITEMS FOR THE DIVISION CHIEF, CoRP:
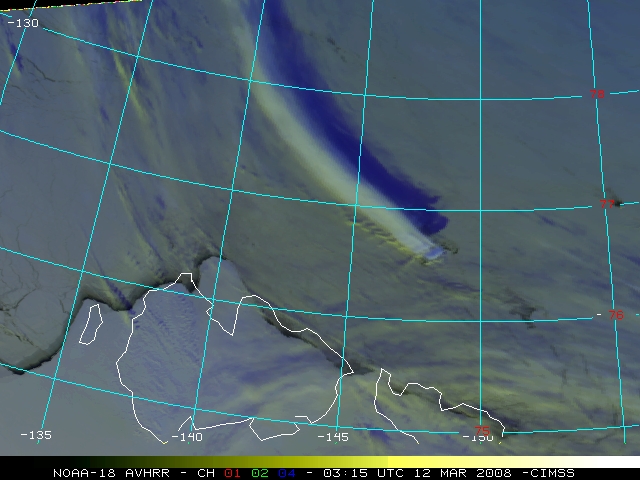
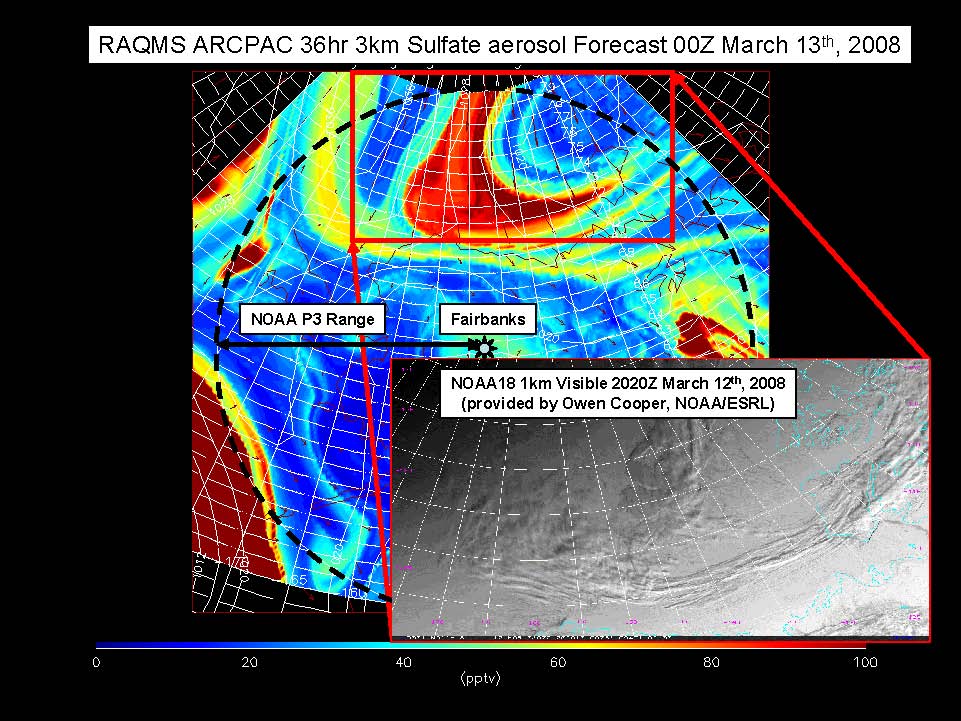
Satellite Analysis of a Bennett Island Plume: A
satellite-based analysis of the so-called "Bennett Island Plume" over
the East Siberian Sea was added to the Cooperative Institute for
Meteorological Satellite Studies (CIMSS) Satellite Blog (http://cimss.ssec.wisc.edu/goes/blog/archives/622)
on March 12, 2008. A long cloud plume was seen on satellite products
from the NOAA Advanced Very High Resolution Radiometer (AVHRR) and the
NASA Moderate resolution Imaging Spectroradiometer (MODIS) instruments.
CIMSS polar cloud-tracked atmospheric motion vector products over the
arctic region verified the presence of a southeasterly flow aloft over
Bennett Island. MODIS brightness temperature difference imagery
indicated that the long, high-altitude cloud plume was composed
primarily of ice crystals, possibly above supercooled water droplets.
Up to the early 1990s, the Bennett Island Plume was hypothesized to be
formed from leaking deposits of frozen methane under the ocean floor.
Aircraft studies later indicated that the plume was instead a result of
orography, even though the island is only 1,398 feet in altitude.
(S. Bachmeier, CIMSS,
608-263-3958)
 (Click image to enlarge)
Figure
caption: False color NOAA-18 AVHRR image showing a long Bennett Island
cloud plume over the East Siberian Sea on March 12, 2008.
 (Click image to enlarge)
 (Click image to enlarge)
Other Meetings and Telecons:
None.
VISITORS:
NEXT WEEK:
LOOKING AHEAD:
| Archived Weeklies Page | Submit a report item |