[ Archive ]
| CIMSS-NOAA Weekly Report
[ Archive ] |
IN THE PRESS:
ITEMS FOR THE ADMINISTRATOR:
ITEMS FOR THE ASSISTANT ADMINISTRATOR:
ITEMS FOR THE OFFICE DIRECTOR, STAR:
Highlights from 2015: A milestone year for the UW-Madison Space Science and Engineering Center (SSEC), 2015 marked our first half-century of research, discovery, and innovation. Since 1965, our scientists have striven to provide the people of Wisconsin — and around the globe — with the best information about the Earth and its atmosphere. Selected stories provide a window into the continuing commitment by SSEC and the Cooperative Institute for Meteorological Satellite Studies (CIMSS) to the advancement of science through collaborative research, education, and public engagement are available at http://www.ssec.wisc.edu/news/articles/8305. (H. Revercomb, SSEC, 608-263-6758, J. Phillips, SSEC, 608-262-8164)
 (Click image to enlarge)
Paper Published on AMSR-2 Snow Algorithms: A paper on NOAA's forthcoming algorithms for snow cover and snow depth from the Advanced Microwave Scanning Radiometer 2 (AMSR2) was published in the Journal of Atmospheric and Oceanic Technology. The paper, titled "An in-depth evaluation of heritage algorithms for snow cover and snow depth using AMSR-E and AMSR2 measurements" by Yong-Keun Lee, Cezar Kongoli, and Jeff Key (J. Atmos. Oceanic Tech., 32, 2319-2336, doi: 10.1175/JTECH-D-15-0100.1), provides in-depth validation of the products. These and other AMSR2 products will be operational in NOAA later this year. (J. Key, E/RA2, 608-263-2605, jkey@ssec.wisc.edu; Y-K., Lee, CIMSS, 608-265-0866)
Atmospheric Research Paper Published: A paper was published that was an integrated satellite view of Hurricane Sandy, demonstrating the many types of satellite products that were used throughout the life cycle. The title is “Satellite tools to monitor and predict Hurricane Sandy (2012): Current and emerging products”, and the lead author was Michael Folmer. There were many co-authors, from both the research and operational sides. The supplemental data includes a 1-minute time resolution geostationary imager animation. Details can be found at http://www.sciencedirect.com/science/article/pii/S0169809515001805. (T. Schmit, E/RA2, 608-263-0291, tim.j.schmit@noaa.gov)
10th NASA Air Quality Applied Sciences Team: Brad Pierce attended the 10th and final NASA Air Quality Applied Sciences Team (AQAST, http://acmg.seas.harvard.edu/aqast/) on January 5-7, 2016, at the US Environmental Protection Agency (EPA) Research Laboratory in Durham, North Carolina. He gave a talk entitled AQAST NOAA/NESDIS Liaison Highlights and Planning for a Future Great Lakes Airborne Mission” which summarized AQAST Tiger Team accomplishments and follow-on activities during the past 5 years of AQAST evolvement as the NOAA/NESDIS Liaison and provided an overview of current planning activities with the Wisconsin Department of Natural Resources (DNR,http://dnr.wi.gov/topic/airquality/) and Lake Michigan Air Directors Consortium (LADCO, http://www.ladco.org/) for a field mission in the summer of 2017 focusing on characterizing ozone formation chemistry, emissions, meteorology and transport along the Great Lakes’ shorelines with the ultimate goal of improving photochemical modeling along the lake shores (R.B. Pierce, E/RA2, 608-890-1892, brad.pierce@noaa.gov)
ITEMS FOR THE DIVISION CHIEF, CoRP:
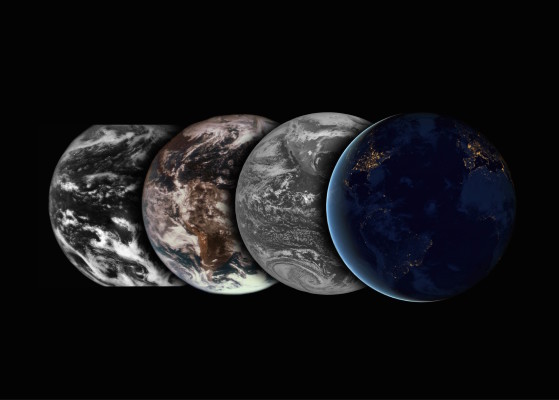
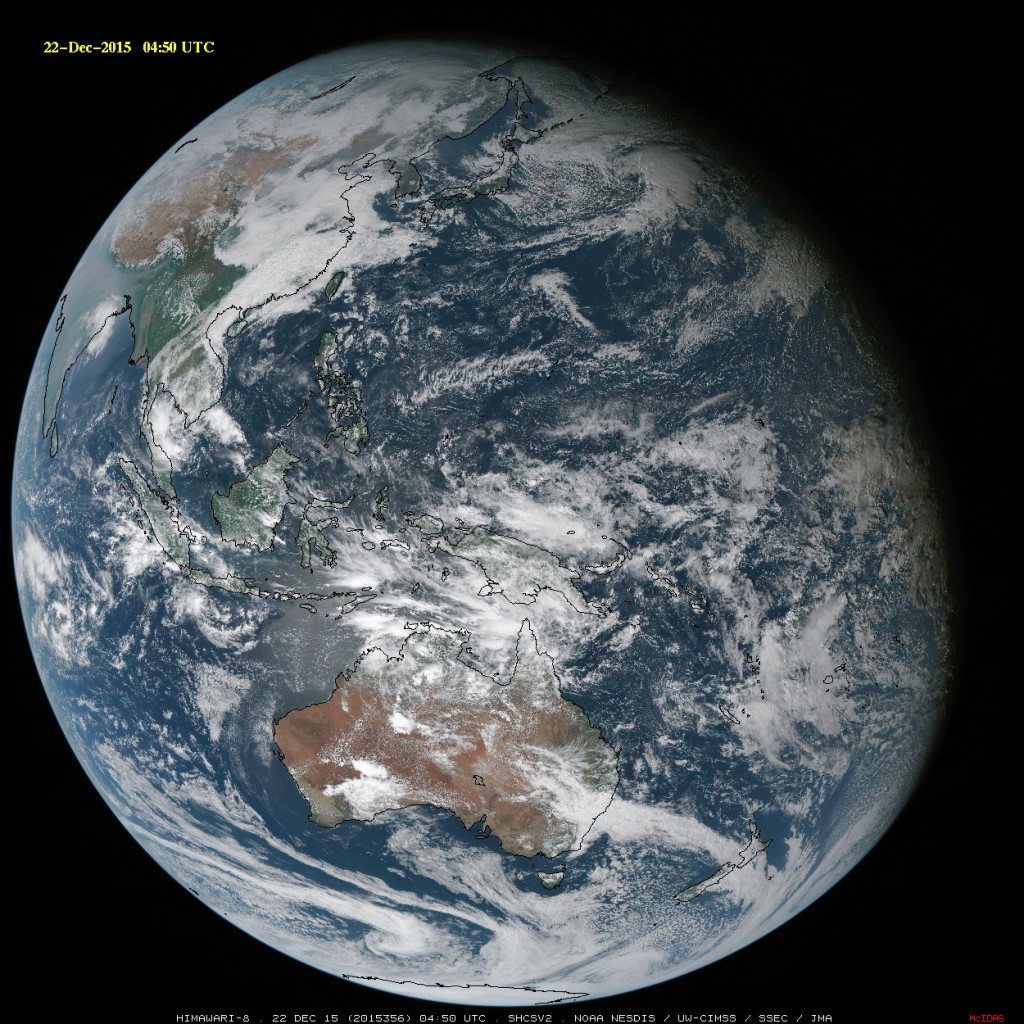
CIMSS Satellite Blog on the Winter Solstice: A Cooperative Institute for Meteorological Satellite Studies (CIMSS) Satellite Blog, entitled "Some Solstice Satellite Scenes", was posted. This entry includes animations from Geostationary Operational Environmental Satellite (GOES) East and West and Japan Meteorological Agency (JMA)'s Advanced Himawari Imager (AHI). More can be found at http://cimss.ssec.wisc.edu/goes/blog/archives/20293, including a full disk color animation from AHI: http://goo.gl/3jMnoo. As a side note, the New York Times top visual story of 2015 included a full disk AHI animation: http://www.nytimes.com/interactive/2015/us/year-in-interactive-storytelling.html. (T. Schmit, E/RA2, 608-263-0291, tim.j.schmit@noaa.gov; S. Bachmeier, CIMSS, 608-263-3958; Y. Sumida, visiting scientist from JMA)
 (Click image to enlarge)
Pyrocumulonibus Clouds in Western Australia: The first documented case of a pyrocumulonimbus (pyroCb) cloud in 2016 occurred with the large Waroona bush fire south of Perth in Western Australia on January 6. Two additional pyroCb events followed on January 7. Imagery and animations can be found on the PyroCb Blog (http://pyrocb.ssec.wisc.edu/archives/1531). (S. Bachmeier, CIMSS, 608-263-3958)
 (Click image to enlarge)
PACE OCI Radiative Transfer Model Developed: A. Heidinger is a member of the NASA Pre-Aerosol, Clouds and Ocean Ecosystem (PACE) Science Team. PACE is mission that was defined in last NASA Decadal Survey and is focused on making measurements to support ocean ecology and global biogeochemistry. The current instrument payload of PACE includes an Ocean Color Imager (OCI) which will notionally provide 9 channels from 0.6 to 2.2 microns dedicated for cloud remote sensing. A. Heidinger and A. Walther developed a radiative transfer model which can simulate all of OCI cloud channels. This model is called CICKER (CIMSS Correlated-K) and is based on the previously developed Successive Order of Interaction (SOI) model which is used the Community Radiative Transfer Model (CRTM). This model has been delivered to the science team and will be demonstrated at the upcoming PACE Science Team meeting in late January 2016. (A. Heidinger, E/RA2, 608-263-6757, andrew.heidinger@noaa.gov, A. Walther, CIMSS, andi.walther@ssec.wisc.edu)
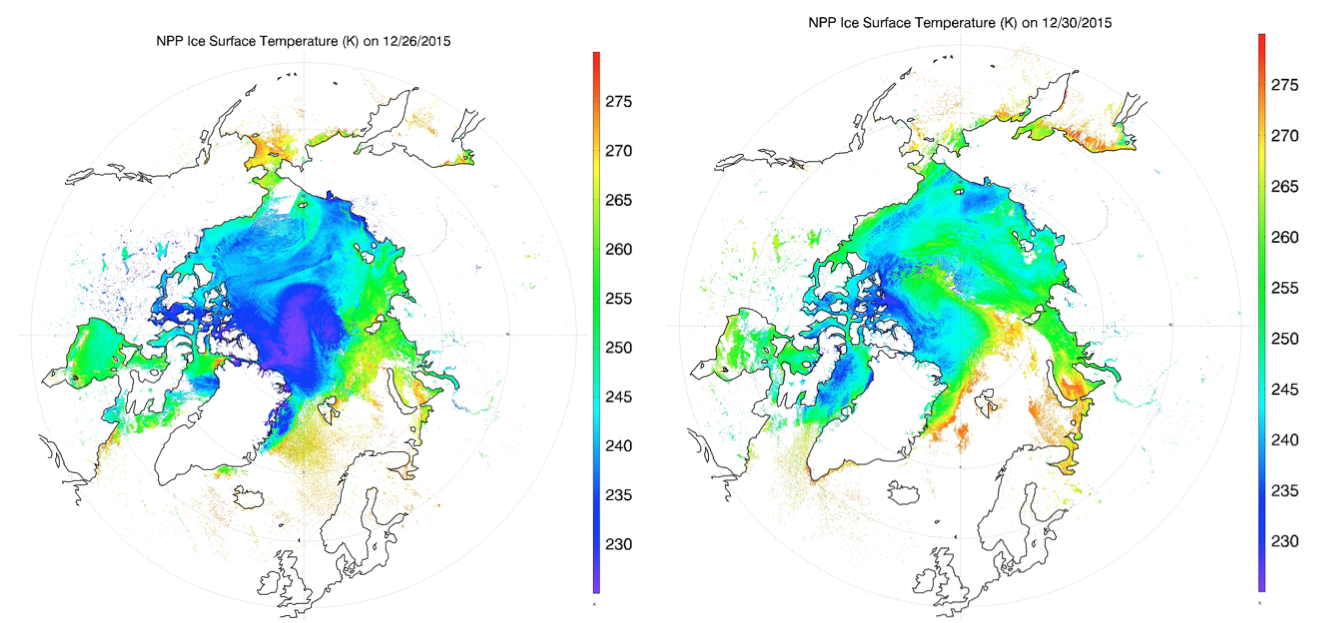
VIIRS Ice Surface Temperature Product Captures Extreme Arctic Warming Event: On December 30, 2015, the central Arctic Ocean came almost reached the melting point, an extreme warming event caused by the influx of warm air from the south due to "Storm Frank". The area near the North Pole was a similar temperature to Vienna and Chicago, and warmer than some parts of the U.S. Midwest. The temperature change from just a few days before was as high as 35° C in some areas. The enterprise VIIRS Ice Surface Temperature (IST) product captured this influx of warm air, as illustrated in Figure 1 and in the multi-day animation at http://goo.gl/tSLeib. A Washington Post news article on the subject (there were many others) is at https://goo.gl/5O6pF7. (J. Key, E/RA2, 608-263-2605, jkey@ssec.wisc.edu; Y. Liu, CIMSS, 608-265-8620; R. Dworak, CIMSS, 608-265-8620)
 (Click image to enlarge)
VISITORS:
NEXT WEEK:
LOOKING AHEAD:
| Archived Weeklies Page | Submit a report item |