[ Archive ]
| CIMSS-NOAA Weekly Report
[ Archive ] |
IN THE PRESS:
ITEMS FOR THE ADMINISTRATOR:
ITEMS FOR THE ASSISTANT ADMINISTRATOR:
ITEMS FOR THE OFFICE DIRECTOR, STAR:
Second Asia Global Cryosphere Watch Workshop: The World Meteorological Organization (WMO) Global Cryosphere Watch (GCW) program held its Second Asia CryoNet meeting in Salekhard, Russia, western Siberia, 2-5 February 2016. CryoNet is the core of the GCW surface observing network. The workshop was organized by the Arctic and Antarctic Research Institute (AARI) of Roshydromet and the Administration of the Yamal-Nenets Autonomous Okrug (YaNAO). There were three days of plenary meetings in the YaNAO Administration building and one day of field training on Ob River north of Salekhard. Jeff Key, the GCW Senior Science Advisor, attended and presented on recent accomplishments and the status of GCW. The main objective of the workshop was to develop practical aspects of the implementation of CryoNet in Asia based on the decisions of the Seventeenth World Meteorological Congress (25 May – 12 June 2015). This includes, among others, identifying new stations/sites that could become CryoNet or contributing sites in both terrestrial and marine environments in Asia, reviewing existing observing practices for cryospheric observations and examining advances in measurement techniques, and discussing data policies. There was considerable media coverage of the event, including Key and three of the other workshop organizers discussing the cryosphere on a local TV show. Media coverage is listed on the GCW website at http://globalcryospherewatch.org/meetings/salekhard2016/media.html. The workshop was very productive, with more than 20 sites in the "Third Pole" (Himalaya) region and Siberia being proposed as new CryoNet sites. (J. Key, E/RA2, 608-263-2605, jkey@ssec.wisc.edu)
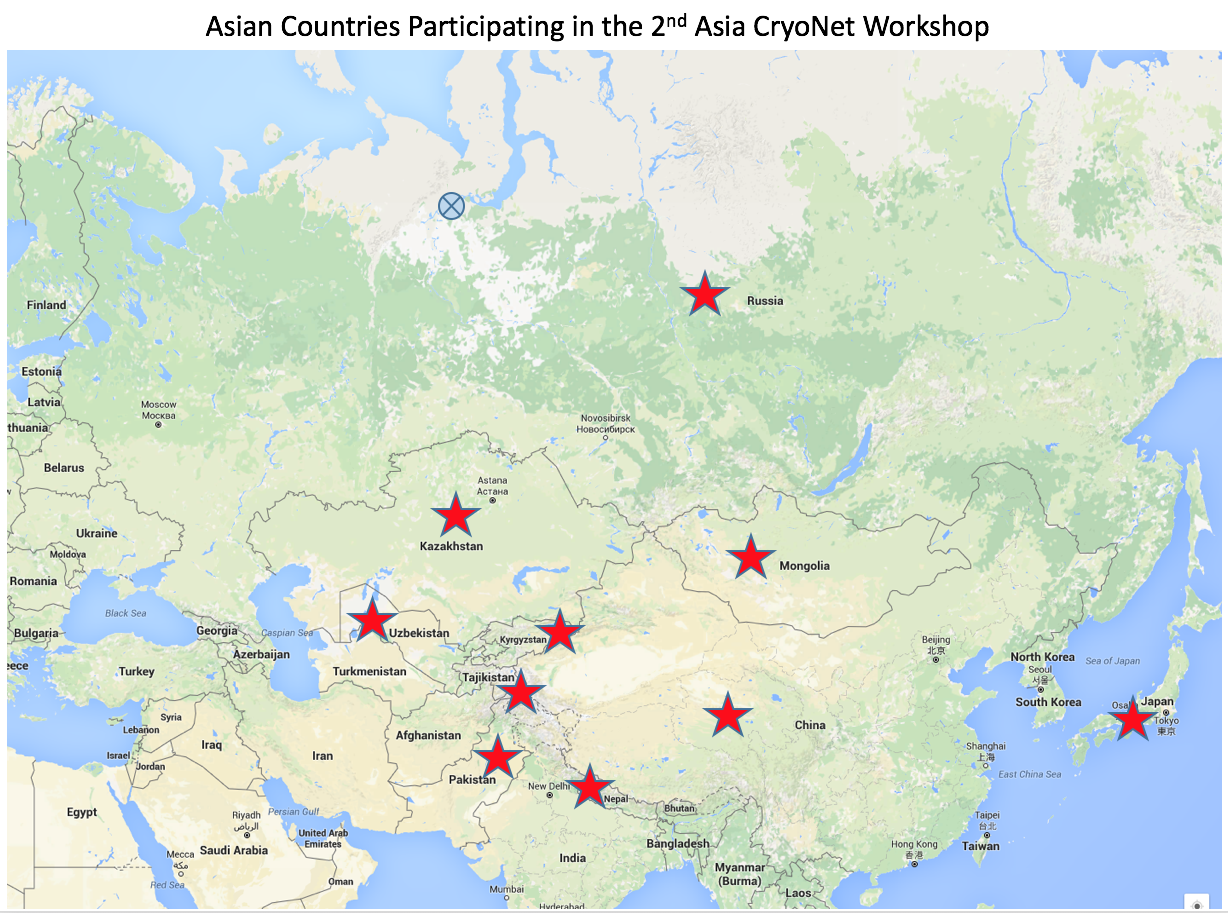
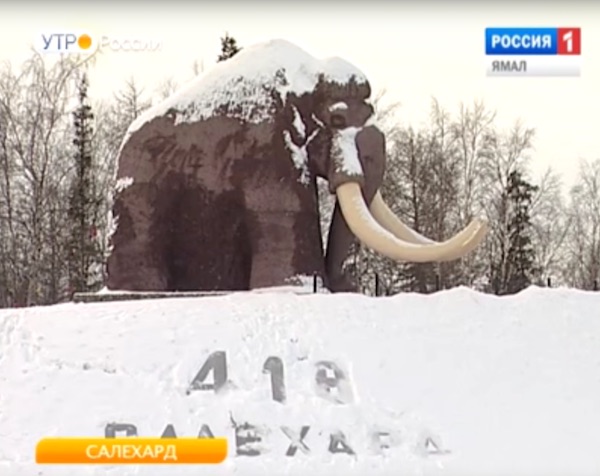
Figure caption: Left: Map of Asian countries with representatives at the 2nd Asia CryoNet Workshop. Salekhard is indicated by the circled "X". Right: Wooly Mammoth statue north of Salekhard appearing in one of the TV videos.
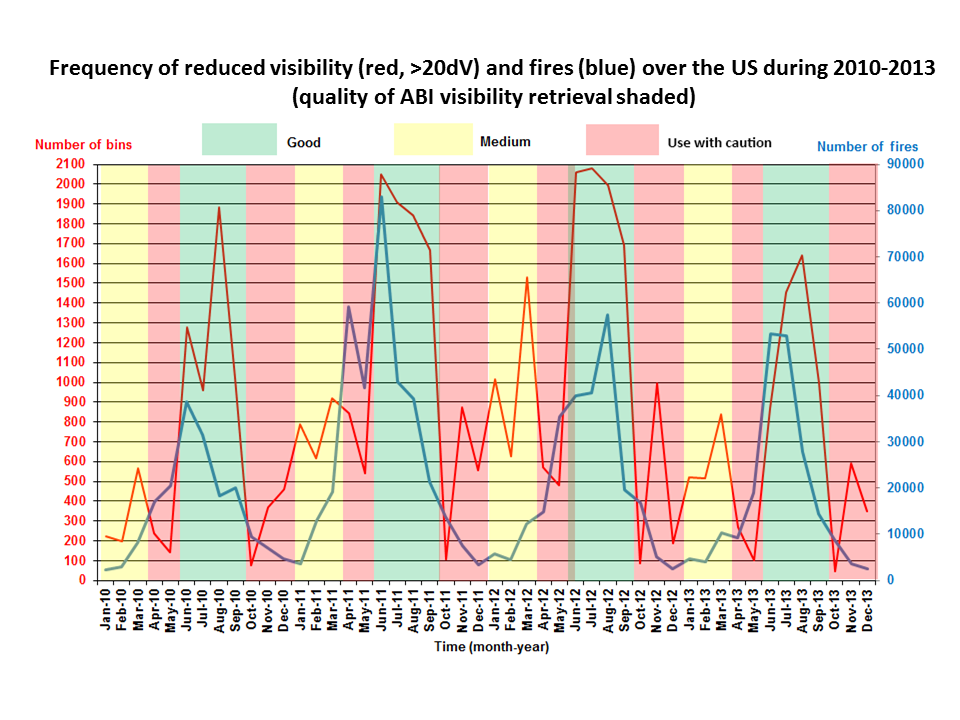
GOES-R ABI Visibility Manuscript Published: A manuscript entitled “Development and validation of satellite-based estimates of surface visibility” by Jason Brunner, R. Bradley Pierce, and Allen Lenzen was published in Atmospheric Measurement Techniques (doi:10.5194/amt-9-409-2016). The manuscript discusses a satellite-based surface visibility retrieval developed using Moderate Resolution Imaging Spectroradiometer (MODIS) measurements as proxies for Advanced Baseline Imager (ABI) data from the next generation Geostationary Operational Environmental Satellites (GOES-R). The manuscript demonstrates that the aerosol component of the GOES-R ABI visibility retrieval can be used to augment measurements from the United States Environmental Protection Agency (EPA) and National Park Service (NPS) Interagency Monitoring of Protected Visual Environments (IMPROVE) network and provide useful information to the regional planning offices responsible for developing mitigation strategies required under the EPA’s Regional Haze Rule, particularly during regional haze events associated with smoke from wildfires (R.B. Pierce, E/RA2, 608-890-1892, brad.pierce@noaa.gov, J. Brunner, CIMSS, A. Lenzen CIMSS)
 (Click image to enlarge)
Figure caption: Frequency reduced aerosol visibility values (>20 deciview, dV) (red line plot) and frequency of Wildfire Automated Biomass Burning Algorithm (WFABBA) detected fires (blue line plot) by month in the United States for January 2010 through December 2013. A deciview is metric of haze proportional to the logarithm of the atmospheric extinction with values >20dV associated with visible haze. Reduced visibility over the United States occurs in May-September and is most frequent during years with significant wild fires (2011 and 2012). The quality of the ABI visibility retrieval is indicated by the shading with green being good (Heidke skill score ~0.3), medium (Heidke skill score ~0.2), and use with caution (Heidke skill score ~0.1).
GOES-14 1-minute Imagery of Lake Effect Snow: The Geostationary Operational Environmental Satellite (GOES)-14 Super Rapid Scan Operations for GOES-R (SRSOR) imagery data collection captured many unique cases, including lake effect snow from the Great Lakes and even from Lake Wheeler in northern Alabama. These 1-minute data are being used to better prepare operational forecasters and others for the mesoscale mode on the Advanced Baseline Imager (ABI). More information on the daily schedules and image center points is available at http://cimss.ssec.wisc.edu/goes/srsor2016/GOES-14_SRSOR.html. Cooperative Institute for Meteorological Satellite Studies (CIMSS) Satellite Blog entries, including many animations, are available at http://cimss.ssec.wisc.edu/goes/blog/archives/category/goes-14. (T. Schmit, E/RA2, 608-263-0291, tim.j.schmit@noaa.gov; S. Bachmeier, CIMSS, 608-263-3958; Jim Nelson, CIMSS, S. Lindstrom, CIMSS)
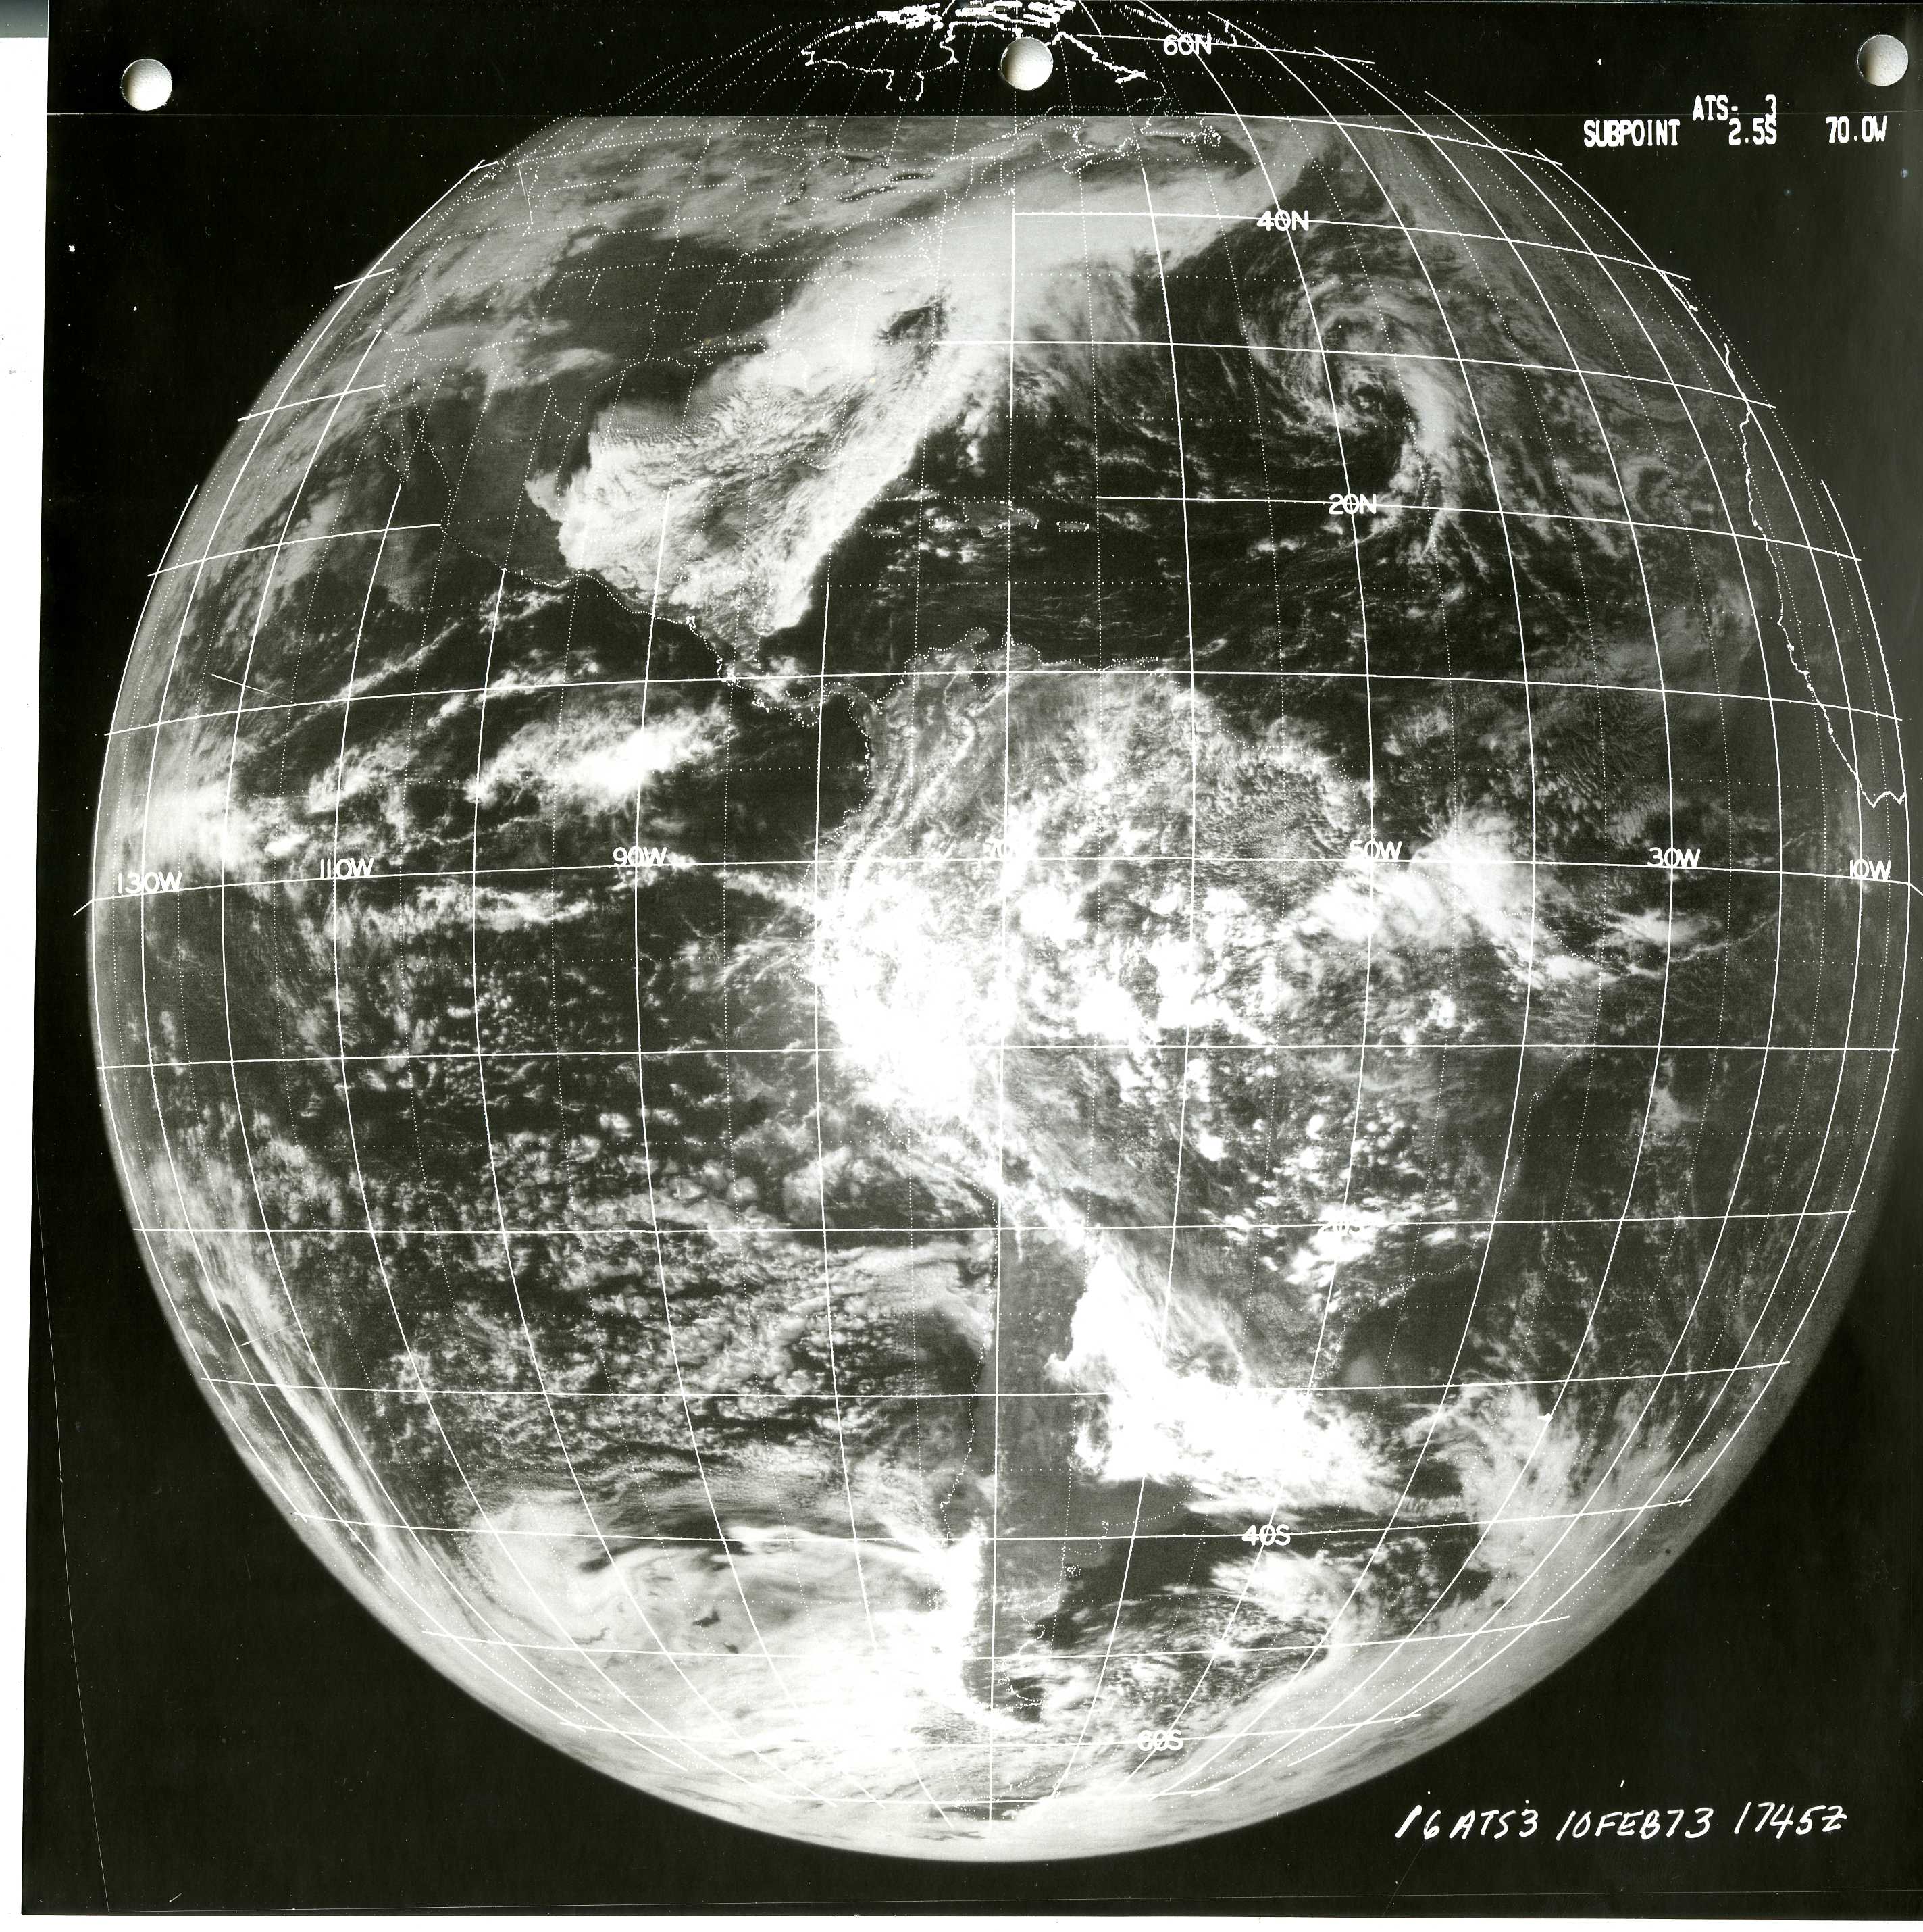
ATS-3 Images From the Archives: The Space Science and Engineering Center's Schwerdtfeger Library provided the Advanced Technology Satellite (ATS)-3 imagery for NOAA scientist Tim Armstrong's analysis of the Great Southeastern Snowstorm of February 9-11, 1973. Synchronous Meteorological Satellite (SMS)-1 wasn't launched until 1974 and GOES-1 would not return data until late 1975; however, ATS-3, operated by NASA, was in orbit during the snowstorm and provided visible imagery of the event every 30 minutes:http://www.weather.gov/ilm/Feb1973Snow. (J. Phillips, SSEC, 608-262-8164)
 (Click image to enlarge)
Figure caption: ATS-III image from 10 February 1973 at 1745Z.
ITEMS FOR THE DIVISION CHIEF, CoRP:
CIMSS and NWS Green Bay Meet about Airborne Observations: Personnel from the Cooperative Institute for Meteorological Satellite Studies (CIMSS) traveled to the National Weather Service (NWS) Green Bay weather forecast office on 10 February 2016 in order to achieve numerous goals involving the Water Vapor Sensing System II (WVSS-II) instrument, an in situ probe mounted aboard commercial aircraft. CIMSS is currently developing an Advanced Weather Interactive Processing System (AWIPS) plug-in so that NWS forecasters can access these airborne observations and aircraft-based soundings in near-real-time from their workstations. This trip allowed for the current version of the plugin to be beta-tested, allowed forecasters to provide input for desired features, and provided the opportunity to outline the methods by which CIMSS and the National Weather Service will train forecasters on how to access and interpret the data. (Tim Wagner, CIMSS, 608-890-1980, R. Petersen, CIMSS, 608-263-4030, and Jordan Gerth, CIMSS, 608-263-4942).
Guest Lecture on Air Quality Modeling: Brad Pierce gave a guest lecture entitled “Development and applications of Air Quality Models: Real-time Air Quality Modeling System” for students in the Spring 2016 “Air Quality Modeling and Analysis” class offered by the University of Madison-Wisconsin Nelson Institute for Environmental Studies and the Department of Atmospheric and Oceanic Sciences (R.B. Pierce, E/RA2, 608-890-1892, brad.pierce@noaa.gov)
SNPP VIIRS Cloud Climatology: The majority of the NOAA Enterprise cloud algorithms have been run routinely at the Cooperative Institute for Meteorological Satellite Studies (CIMSS) since January 2015 to prepare for their operational implementation in the summer of 2016. The cloud team has been doing some preliminary climate-scale analysis of these products and is exploring the extension of NOAA Pathfinder Atmospheres Extended (PATMOS-x) cloud records with data from the Suomi National Polar-Orbiting Partnership (SNPP) Visible Infrared Imaging Radiometer Suite (VIIRS). The image below shows the NOAA Enterprise ice cloud fraction for January 2015 and January 2016. January 2016 occurred during the current El Nino, which began in the middle of 2015. These images show the dramatic change in cloudiness during El Nino events. As these images show, the mass of Tropical ice cloud shifts from the Western Pacific to the Central Pacific. We hope to include SNPP cloud analysis in the upcoming Bulletin of the American Meteorological Society (BAMS) State of the Climate. (A. Heidinger, E/RA2, 608-263-6757, andrew.heidinger@noaa.gov, D. Botambekov, CIMSS, denis.botambekov@ssec.wisc.edu)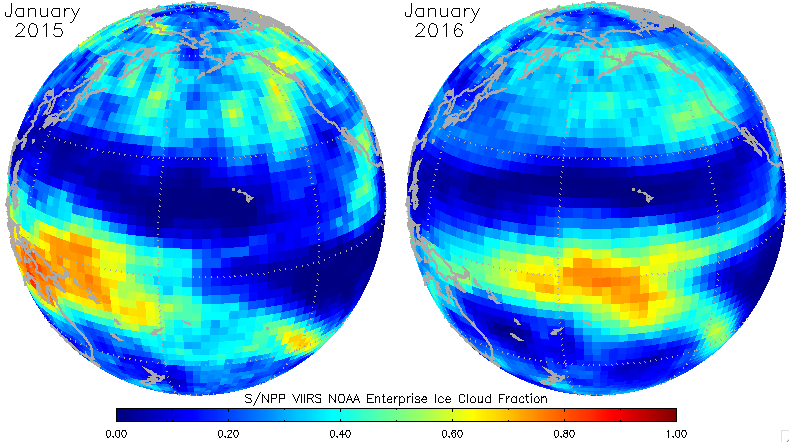 (Click http://cimss.ssec.wisc.edu/goes/srsor2016/GOES-14_SRSOR.htmlimage to enlarge)
VISITORS:
NEXT WEEK:
LOOKING AHEAD:
| Archived Weeklies Page | Submit a report item |