[ Archive ]
| CIMSS-NOAA Weekly Report [ Archive ] |
ASPB AND CIMSS WEEKLY HIGHLIGHTS FOR THE WEEK ENDING OCTOBER 20, 2017
IN THE PRESS:
ITEMS FOR THE ADMINISTRATOR:
ITEMS FOR THE ASSISTANT ADMINISTRATOR:
ITEMS FOR THE OFFICE DIRECTOR, STAR:
Paper Published on NOAA's AMSR2 Sea Ice Product: The implementation of a NOAA passive microwave sea ice concentration algorithm is presented in the recently published paper "Operational implementation of sea ice concentration estimates from the AMSR2 sensor", by W.N. Meier, J.S. Stewart, Y. Liu (CIMSS), J. Key (STAR), and J. Miller (2017, IEEE J. Selected Topics Appl. Earth Obs. Remote Sens. (J-STARS), 10(9), 3904-3911, doi: 10.1109/JSTARS.2017.2693120). Validation studies show that in most cases, the NOAA operational requirements for accuracy are met. However, in low-concentration regimes, such as during melt and near the ice edge, errors are higher because of the limitations of passive microwave sensors and the algorithm retrieval. (J. Key, E/RA2, 608-263-2605, jkey@ssec.wisc.edu)
ITEMS FOR THE DIVISION CHIEF, CoRP:
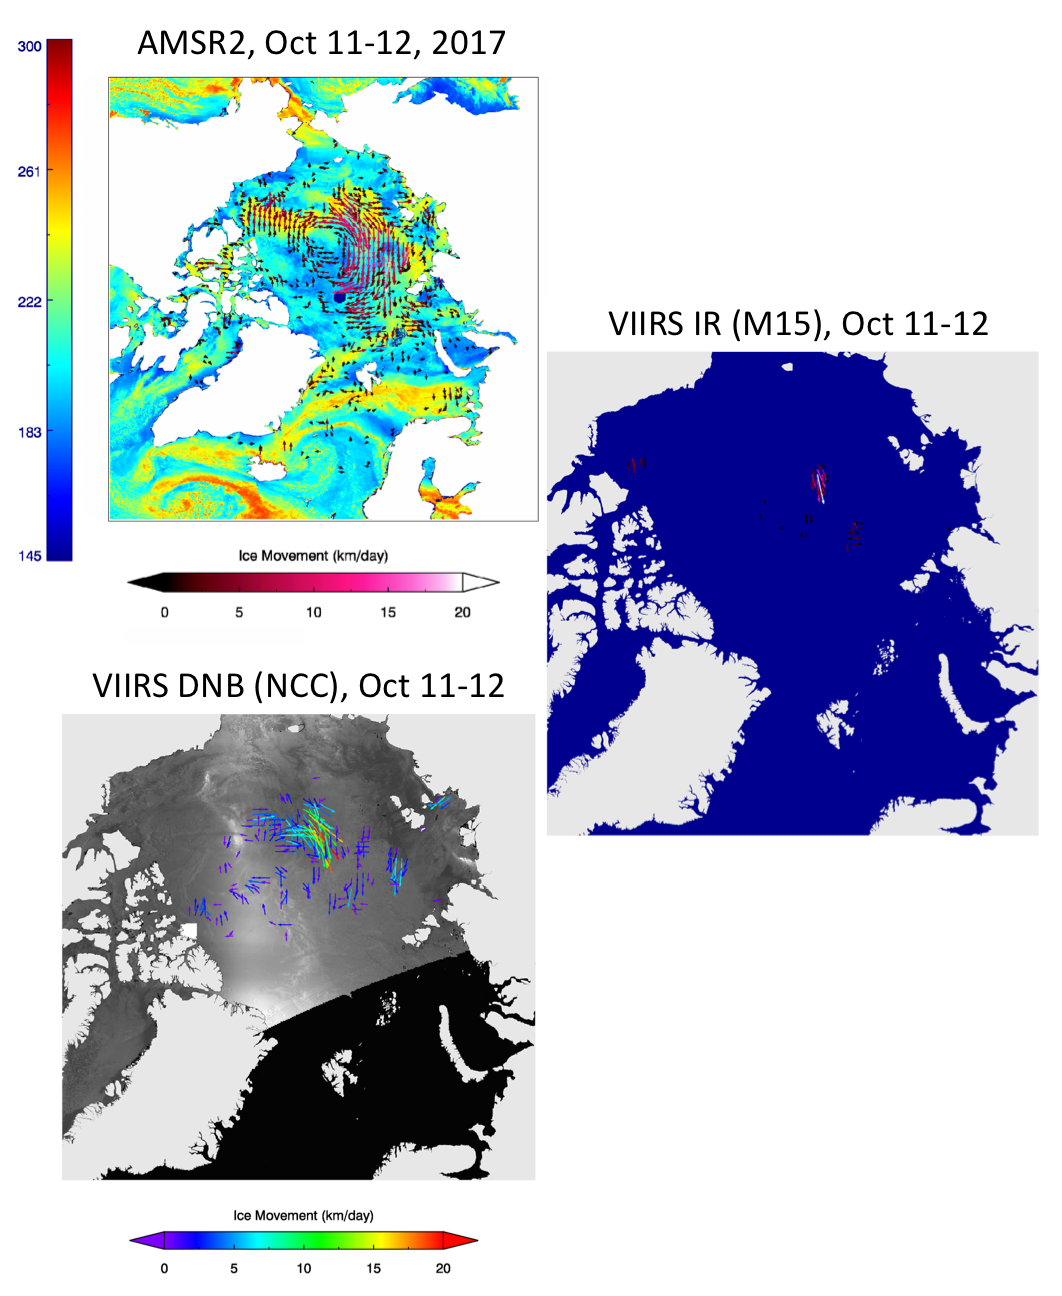
Ice Motion from AMSR2, VIIRS IR, and VIIRS Day-Night Band: Experimental ice motion products from the Visible Infrared Imaging Radiometer Suite (VIIRS) and the Advanced Microwave Scanning Radiometer 2 (AMSR2) continue to be developed and improved. Ice motion is now derived separately from AMSR2 (89 GHz channel), the VIIRS M15 (infrared) band, and the VIIRS Day-Night Band (DNB) Near Constant Contrast (NCC) product, and generated routinely at the Cooperative Institute for Meteorological Satellite Studies (CIMSS). Additionally, AMSR2 and VIIRS M15 motion vectors are blended into a single product. Examples of the three individual products are shown in the figure below for a single 24-hour period over the Arctic. The lower-resolution, all-weather AMSR2 data provides a broad view of the motion field, though it misses some of the small-scale motion that is captured by VIIRS. However, VIIRS ice tracking is limited to clear-sky areas, so there are fewer vectors than for AMSR2. (A. Letterly, CIMSS, 608-890-1981; J. Key, E/RA2, 608-263-2605, jkey@ssec.wisc.edu)
 (Click image to enlarge)
Figure caption: Arctic sea ice motion on October 11-12, 2017, from AMSR2 (left), the VIIRS M15 IR band (center), and the VIIRS day-night band (right).
Record-Setting Hurricane Ophelia Affects Ireland and the United Kingdom: Hurricane Ophelia became the 10th consecutive Atlantic basin hurricane of the 2017 season on October 14, and also set a record for the farthest east Category 3 storm on record. Two days later, the post-tropical remnants of Ophelia brought wind gusts of 119 miles per hour and blowing sand to parts of Ireland and the United Kingdom. Geostationary Operational Environmental Satellite (GOES)-13, MODerate Resolution Imaging Spectroradiometer (MODIS) and Meteosat-10 images and animations were posted on the Cooperative Institute for Meteorological Satellite Studies (CIMSS) Satellite Blog (http://cimss.ssec.wisc.edu/goes/blog/?s=Ophelia). (S. Bachmeier, CIMSS, 608-263-3958)
 (Click image to enlarge)
Figure caption: EUMETSAT Meteosat-10 Water Vapor (7.35 µm) image at 0715 UTC on October 16, 2017, showing the characteristic "scorpion tail" signature of a sting jet which was transporting strong winds toward Ireland and the United Kingdom.
VISITORS:
NEXT WEEK:
LOOKING AHEAD:
| Archived Weeklies Page | Submit a report item |