[ Archive ]
| CIMSS-NOAA Weekly Report [ Archive ] |
ASPB AND CIMSS WEEKLY HIGHLIGHTS FOR THE WEEK ENDING NOVEMBER 2, 2018
IN THE PRESS:
ITEMS FOR THE ADMINISTRATOR:
ITEMS FOR THE ASSISTANT ADMINISTRATOR:
ITEMS FOR THE OFFICE DIRECTOR, STAR:
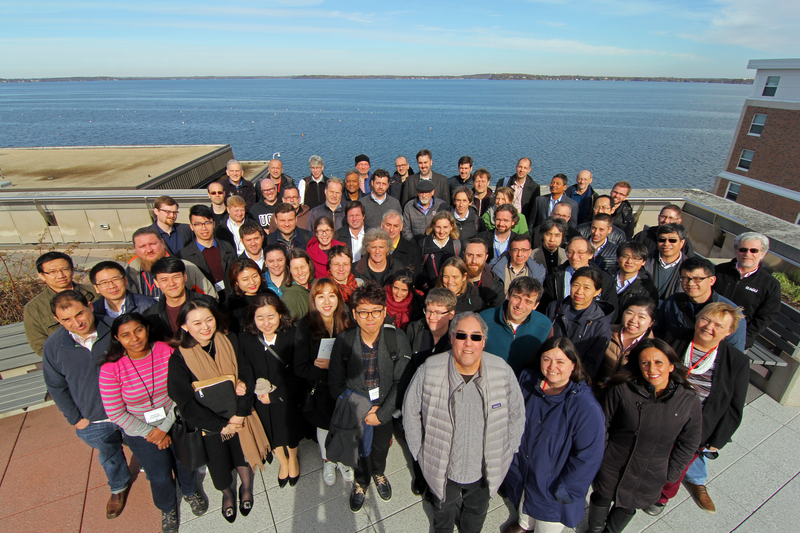
International Cloud Working Group Meeting: The International Cloud Working Group (ICWG) met for this week in Madison, Wisconsin on the campus of the University of Wisconsin. The ICWG is one of several working groups which report to the Coordination Group for Meteorological Satellites (CGMS) . Over 80 scientists attended the second meeting of the ICWG and included representative from Europe, Asia, North America and Australia. The workshop included many scientific presentations on topics relevant to the satellite cloud community. The workshop also included breakout sessions where detailed group discussions were held on high priority topics. The ICWG has a strong connection to the International Winds Working Group (IWWG). Representatives from 3 other CGMS working groups and the Global Space-based Inter-Calibration System (GSICS) were in attendance. A report will be drafted and shared with CGMS two weeks after the meeting. (A. Heidinger, E/RA2, andrew.heidinger@noaa.gov, M. Pavolonis, E/RA2, michael.pavolonis@noaa.gov)
 (Click image to enlarge)
Figure: ICWG-2 Group Photograph.
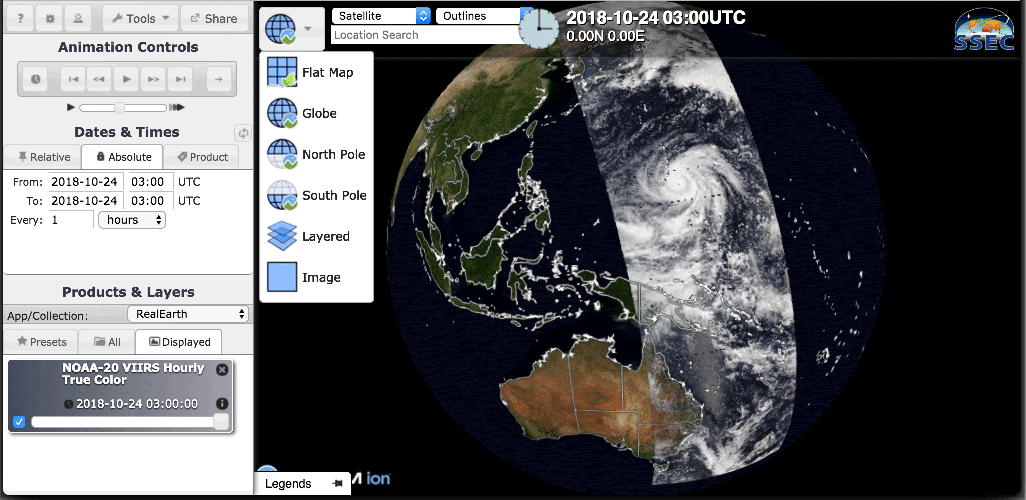
RealEarth 5.0 Released: RealEarth 5.0 represents a major upgrade to our traditional browser interface. It is included as part of the RealEarth 5.0 VM release. Key features include: switch to Leaflet and Cesium base map API and globe; multiple map “views” to choose from (such as Flat Map, Globe, North Pole, South Pole); smoother pan, zoom, and animation; offline capable; and a new companion website: https://www.ssec.wisc.edu/realearth. Try RealEarth 5.0 at https://realearth.ssec.wisc.edu. When we developed RealEarth in 2011, the most mature API for web mapping was Google. It has served us well for many years. However, we encountered limitations with implementing new choices of projections (other than web-Mercator). We also experienced interface disruptions as Google terms of use and the requirement of API keys became more stringent. Therefore we have switched to the open source options of the Leaflet API for the “flat map” and the Cesium API for new globe and polar views. RealEarth™ is a data discovery and visualization platform developed at SSEC/CIMSS at the University of Wisconsin-Madison to support outreach and collaboration efforts of scientists. The goal is to allow quick and continuous visualization of Earth observation imagery and data in a common and familiar map-based interface. Because the system is built with geographic information system or GIS awareness AND the needs of meteorologic and atmospheric scientists in mind, a wide variety of land, oceanic, and atmospheric remote sensing imagery and related data are available to be layered, compared, and animated in time-series loops. The purpose is not to collect and archive data, but rather to provide rapid visual access to recent and near real-time data in standards-based web mapping formats. The system can be configured to accommodate long-term access and longitudinal studies, but its strength is the programmatic production of near real-time weather web services in OGC-GIS formats that can be accessed directly through our API, browser interface or mobile apps and GIS software such as ArcGIS and QGIS. Users can upload their own data and view it almost immediately, assuming the data are properly formatted. Views of the data can be shared through social media with a simple click or even our simple shared-screen collaboration mode. Our API allows users to embed live maps in their own websites to highlight their own work or ongoing projects. Static and animated graphics can be easily exported for documents or PowerPoint presentations in .png, animated .gif, and .mp4 movie formats. Let us know what you think. Email us at realearth@ssec.wisc.edu
 (Click image to enlarge)
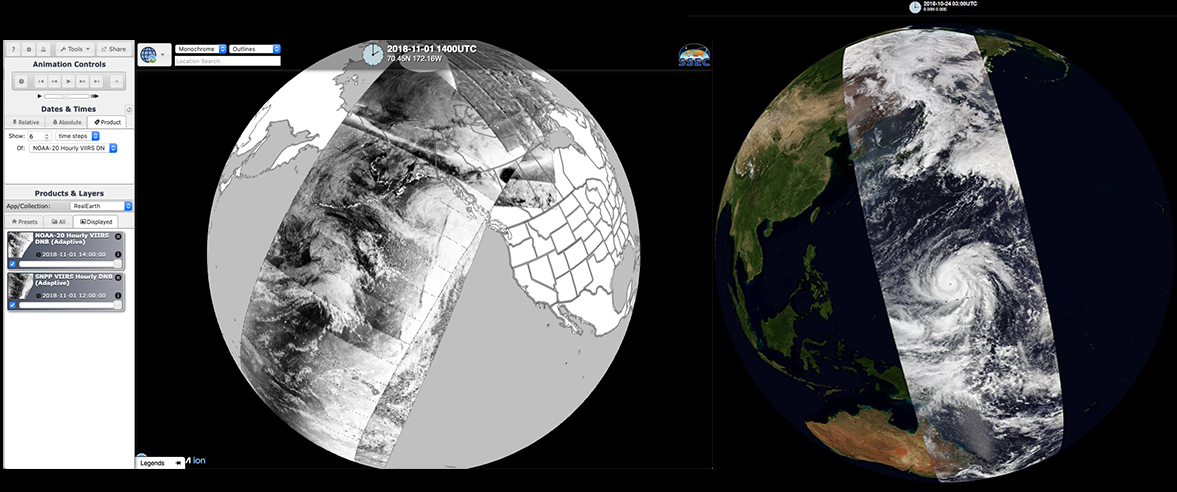
Figure: Screen-shot showing the new "Globe" view in RealEarth 5.0 with near real-time VIIRS True Color on a Bluemarble background. Globe view especially provides a better way to view POES imagery.
NOAA-20 VIIRS data newly available in RealEarth™: Global data from the NOAA-20 Visible Infrared Imaging Radiometer Suite (VIIRS) True Color and Day/Night Band (DNB) is now available in the RealEarth™ visualization platform. Examples of near real-time VIIRS True Color can be viewed at https://re.ssec.wisc.edu/s/tXbgv; DNB is at https://re.ssec.wisc.edu/s/IXaYr. (Russ Dengel, SSEC, (262) 6567, Liam Gumley, CIMSS, (608) 265-5358, Dave Parker, SSEC, (608) 265-0412, Jerrold Robaidek SSEC, (608) 262-6025, Margaret Mooney, CIMSS (608) 265-2123)
 (Click image to enlarge)
New Paper on Shortwave Infrared Band for Weather Analysis: A research article, “It’s not hot air: Using GOES‐16 infrared window bands to diagnose adjacent summertime air masses”, by Jordan Gerth, was accepted for publication in Meteorological Applications, a journal of the Royal Meteorological Society. The article examines several warm season daytime cases in which the Advanced Baseline Imager (ABI) 3.9 µm band depicts a slight but sharp brightness temperature gradient between adjacent air masses in the United States Plains. While the subtle gradient is not evident in all scenes, operational meteorologists in the central United States can use the ABI shortwave infrared band, in addition to other infrared window bands, to discern fronts and outflow boundaries during the day when they are not otherwise delineated with cloudiness. The accepted manuscript is online at https://doi.org/10.1002/met.1767. (J. Gerth, CIMSS, 608-263-4942)
ITEMS FOR THE DIVISION CHIEF, CoRP:
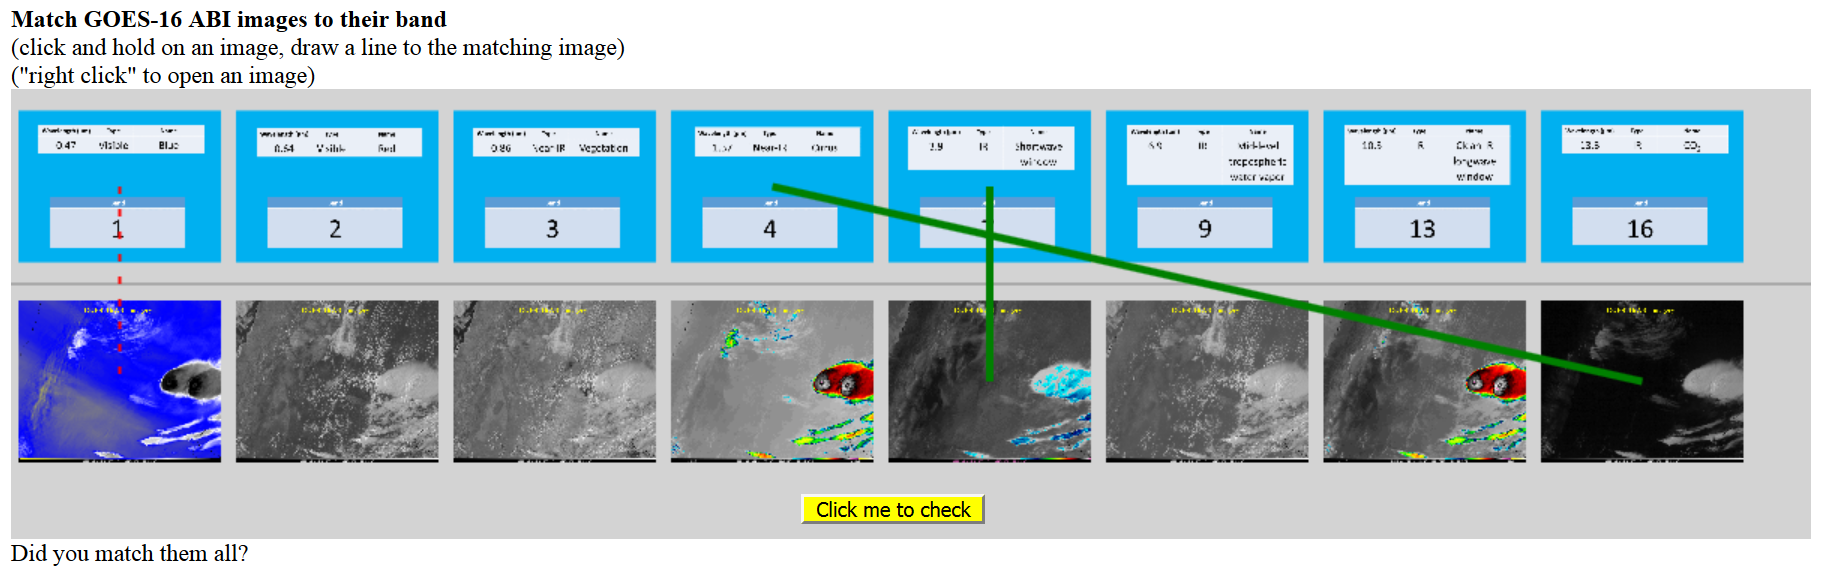
Lectures on the ABI Provided for a Field Experiment in South America: Tim Schmit (NOAA/STAR) and Scott Lindstrom (University of Wisconsin-Madison), both located at the Cooperative Institute for Meteorological Satellite Studies (CIMSS), gave Advanced Baseline Imagery (ABI) training remotely to 30-35 participants in the Remote Sensing of Electrification, Lightning, And Mesoscale/microscale Processes with Adaptive Ground Observations (RELAMPAGO) - Clouds, Aerosols, and Complex Terrain Interactions (CACTI) field experiment in Argentina. More information on this experiment designed to investigate Mesoscale Convective Systems over South America at https://sites.google.com/illinois.edu/relampago/home. Training topics included ABI Channels, Channel Differences, Radiative transfer, Weighting Functions, Scan Modes, Red-Green-Blue (RGB) composites and several case studies. (Tim Schmit, E/RA2, 608 263 0291; Scott Lindstrom, CIMSS, 608 263 4425)
 (Click image to enlarge)
Figure: Screen shot of a partially completed ABI “matching” game for a case over South America. (https://cimss.ssec.wisc.edu/goes/webapps/matching/satmatch_abi_SA1_8.html)
2018 AOSS Trick-or-Treat: On October 26 the Inclusion Community Equity and Diversity (ICED) committee hosted the 2018 AOSS Trick-or-Treat party. We were very excited about the turnout with a total of 18 kids along with their parents attending. The party started off in the Schwerdtfeger library with refreshments and treats followed by a costume contest where kids were able to pick from an assortment of prizes. One highlight of the party was Denny Hackel appearing in a giant inflatable Pickachu outfit which was a bit hit with the kids. After some mingling and fellowship in the library the families then set out to visit 9 different Trick-or-Treat stations throughout the building. Pictures from the event can be viewed at the following link: http://tropic.ssec.wisc.edu/real-time/amsu/iced/2018/halloween/halloween.html. (D. Herndon, CIMSS, 608-262-6741)
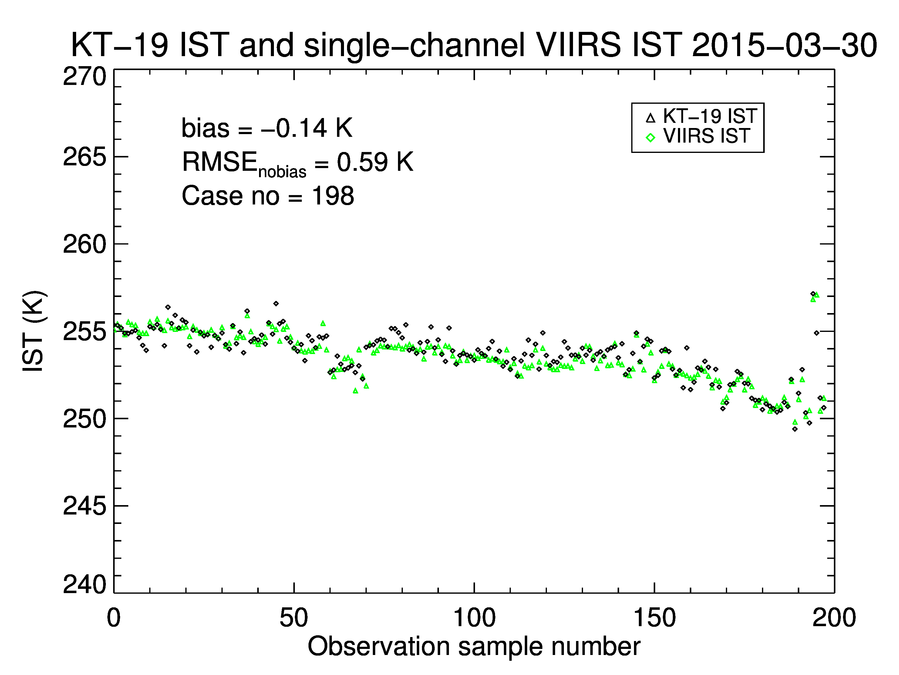
Single-band IST Algorithm: In order to take advantage of the higher spatial resolution of the VIIRS 11.45 micron “I” band at 375 m, a single-band ice surface temperature (IST) algorithm was developed. The operational IST algorithm is a split-window method utilizing 11 and 12 micron bands (M15 and M16). However, VIIRS does not have a 12 micron I band, so a single-band method was needed. The new algorithm and comparisons to the operational split-window VIIRS algorithm and to IST from Landsat are described in a paper recently submitted to the journal Remote Sensing. (J. Key, E/RA2, 608-263-2605, jeff.key@noaa.gov; Y. Liu, CIMSS, 608-265-8620)
 (Click image to enlarge)
Figure: KT-19 ice surface temperature (IST) (black) and single-band IST from S-NPP VIIRS (green) along the P-3 IceBridge flight track around 22:17 UTC on 30 March 2015.
VISITORS:
NEXT WEEK:
LOOKING AHEAD:
| Archived Weeklies Page | Submit a report item |