[ Archive ]
| CIMSS-NOAA Weekly Report [ Archive ] |
CIMSS AND ASPB WEEKLY HIGHLIGHTS FOR THE WEEK ENDING FEBRUARY 5, 2021
PRODUCTS AND APPLICATIONS:
GOES-15 Out of Storage : As part of routine maintenance, Geostationary Operational Environmental Satellite (GOES)-15 has been taken out of storage by the Office of Satellite and Product Operations (OSPO) and is planning to image until February 19. This is not operating for supplemental operations as was done last year. Imager images can be found at the Space Science and Engineering Center (SSEC): https://www.ssec.wisc.edu/data/geo/#/animation?satellite=goes-15. Thanks to the SSEC Data Services for the local ingest and saving of the data. (J. Robaidek, SSEC; T. Schmit, E/RA2, 608-263-0291)
 (Click image to enlarge)
Figure: Non-operational GOES-15 water vapor (band 3) loop from February 5, 2021.
AWARDS AND RECOGNITION:
PUBLICATIONS:
Paper on Comparison of HIRS and MODIS Moisture Determinations Published: A manuscript titled “Observed HIRS and Aqua MODIS Thermal Infrared Moisture Determinations in the 2000s”, by E. Eva Borbas and W. Paul Menzel, has been published by Remote Sensing (https://doi.org/10.3390/rs13030502). This paper compares the tropospheric moisture data records derived from High-resolution Infrared Radiation Sounder (HIRS) and Moderate Resolution Imaging Spectro-radiometer (MODIS) measurements from the years 2003 through 2013. Total Precipitable Water Vapor (TPW) and Upper Tropospheric Precipitable Water Vapor (UTPW) are derived using the infrared spectral bands in the CO2 and H2O absorption bands as well as in the atmospheric windows. Retrieval of TPW and UTPW employs a statistical regression algorithm performed using clear sky radiances (and brightness temperatures) measured over land and ocean for both day and night. The TPW and UTPW seasonal cycles of HIRS and MODIS observations are found to be in synchronization with zonal mean values for one degree latitude bands within 2.0 mm and 0.07 mm, respectively. A major conclusion of this paper is that the MODIS and HIRS tropospheric moisture records compare very well with each other so that determinations from the MODIS years can be a bridge to the years of HIRS data that go back to 1980. (E. Borbas, CIMSS, 608-263-0228, W.P. Menzel, CIMSS, 608-263-4930 )
WORKSHOPS, CONFERENCES, AND MEETINGS:
TRAINING AND EDUCATION:
CIMSS-led Forecaster Training on Satellite Imagery for WFO Guam: Scott Lindstrom from the Cooperative Institute for Meteorological Satellite Studies (CIMSS) gave live (remote) training to staff at the National Weather Service (NWS) Forecast Office on Guam (where the NWS day begins). 90-minute sessions occurred on both Tuesday and Wednesday morning, 2 and 3 February (Guam Time). Topics on Day 1 included Scatterometry, NUCAPS Profiles, and the CIMSS Tropical website, specifically the Advanced Dvorak Technique (ADT) and Satellite Consensus (SATCON) Products. Derrick Herndon from CIMSS added expert commentary on the tropical products. Topics on Day 2 included Himawari Imagery/Uses, Direct Broadcast Data, and Microwave Data. Both sessions were recorded; the recordings and the presentations were made available via the NOAA Google Drive to WFO Guam office staff. (S. Lindstrom, CIMSS, 608 263 4425; D. Herndon, CIMSS)
MEDIA AND OUTREACH:
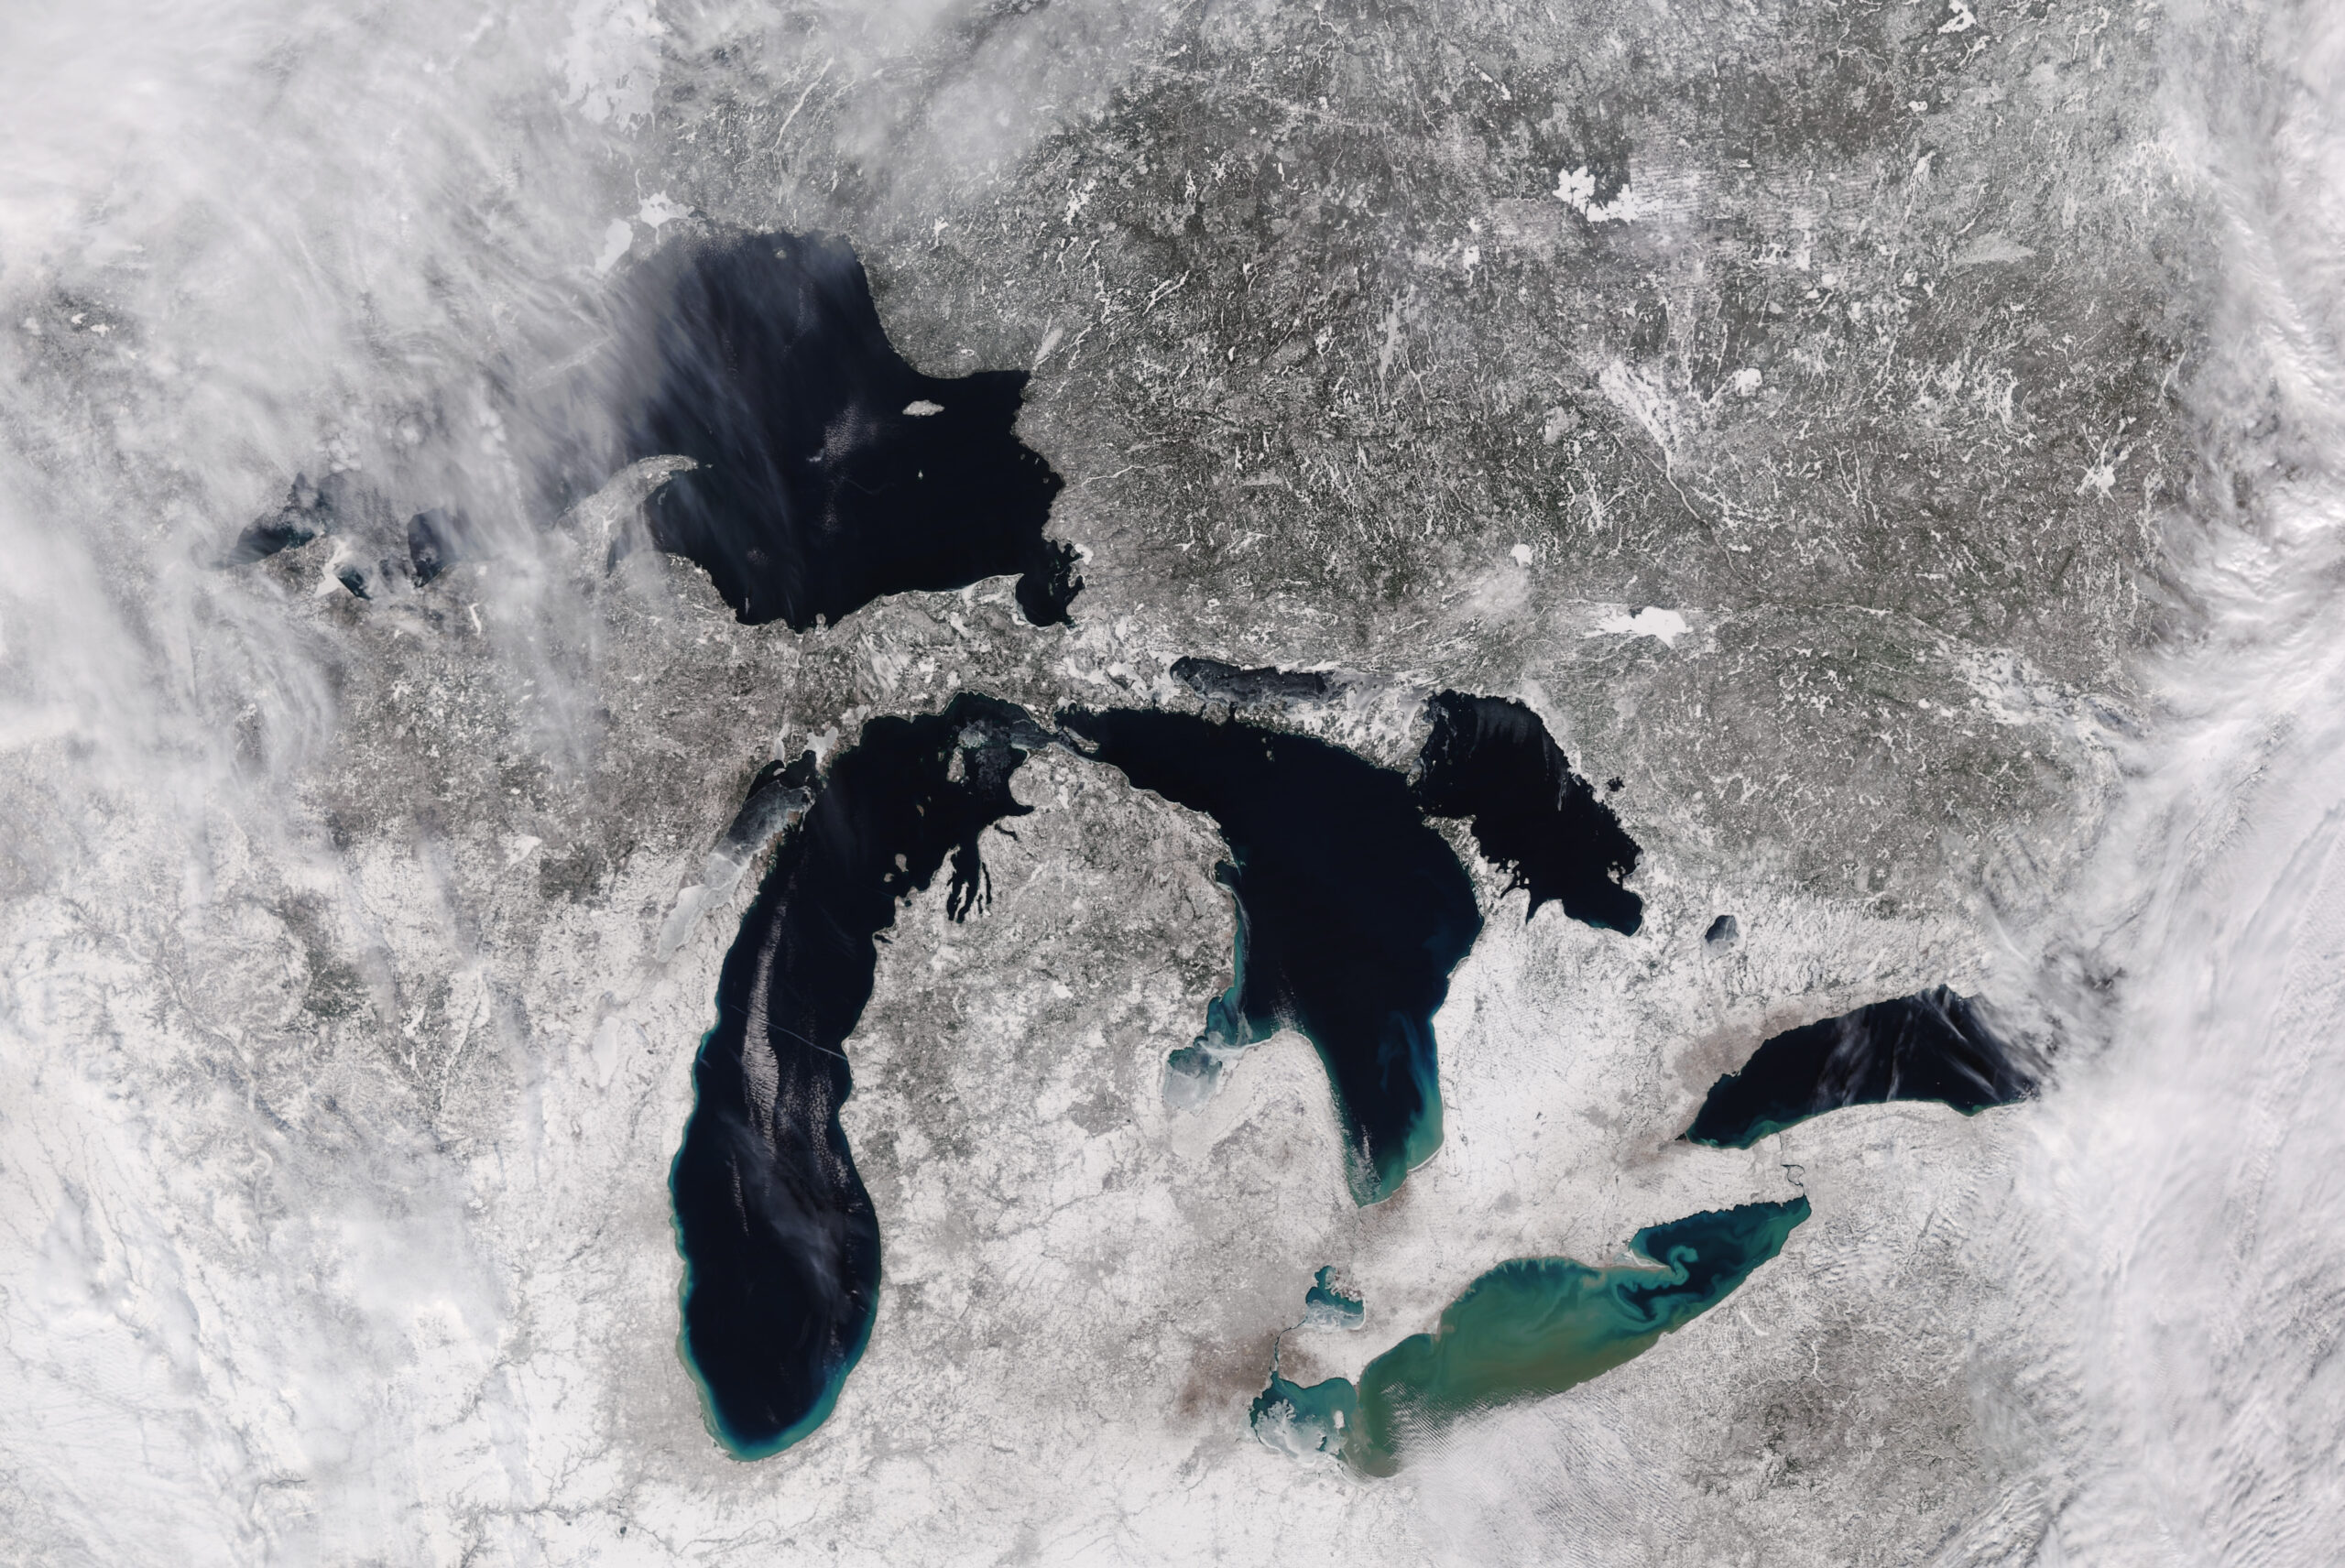
SSEC and CIMSS Scientists in the News: Scientists at the University of Wisconsin-Madison (UW) Space Science and Engineering Center (SSEC) and the Cooperative Institute for Meteorological Satellite Studies (CIMSS) provide expert interviews, imagery and case studies to promote science. This week: 1) Using Meteosat and GOES satellite imagery, CIMSS scientist Scott Bachmeier and EUMETSAT scientist Jochen Kerkmann tracked the breakup of Iceberg A68-A. Read more: https://www.eumetsat.int/iceberg-a68-curves-around-south-georgia-island. 2) CIMSS Satellite Blog contributors Scott Bachmeier and Scott Lindstrom published case studies on "Cold temperatures across the North Slope of Alaska" (Feb. 4), "Winter over the Great Lakes as viewed by VIIRS" (Feb. 3), "Northeast US winter storm" (Feb. 2), "Blowing dust across New Mexico. Texas and Oklahoma" (Jan. 30), and "Geostationary Lightning Mapper (GLM) data displayed with Geo2Grid" (Jan. 30). Read more: https://cimss.ssec.wisc.edu/satellite-blog/. (J. Phillips, SSEC, 608-262-8164, S. Bachmeier, CIMSS, S. Lindstrom, CIMSS)
 (Click image to enlarge)
Figure: A rare, mostly clear day over the Great Lakes on Feb. 3, 2021 allowed NOAA-20 to capture the five Great Lakes in one scene. Read more: https://cimss.ssec.wisc.edu/satellite-blog/archives/39803. Credit: CIMSS, CSPP, Polar2Grid.
 (Click image to enlarge)
Figure: GOES-16 (GOES-East) water vapor images with plots of hourly surface weather type showed the formation of a well-defined storm that hit the Northeast US on Feb. 1-2, 2021. Read more: https://cimss.ssec.wisc.edu/satellite-blog/archives/39783. Credit: CIMSS.
OTHER:
| Archived Weeklies Page | Submit a report item |