[ Archive ]
| CIMSS-NOAA Weekly Report [ Archive ] |
CIMSS AND ASPB WEEKLY HIGHLIGHTS FOR THE WEEK ENDING MARCH 5, 2021
PRODUCTS AND APPLICATIONS:
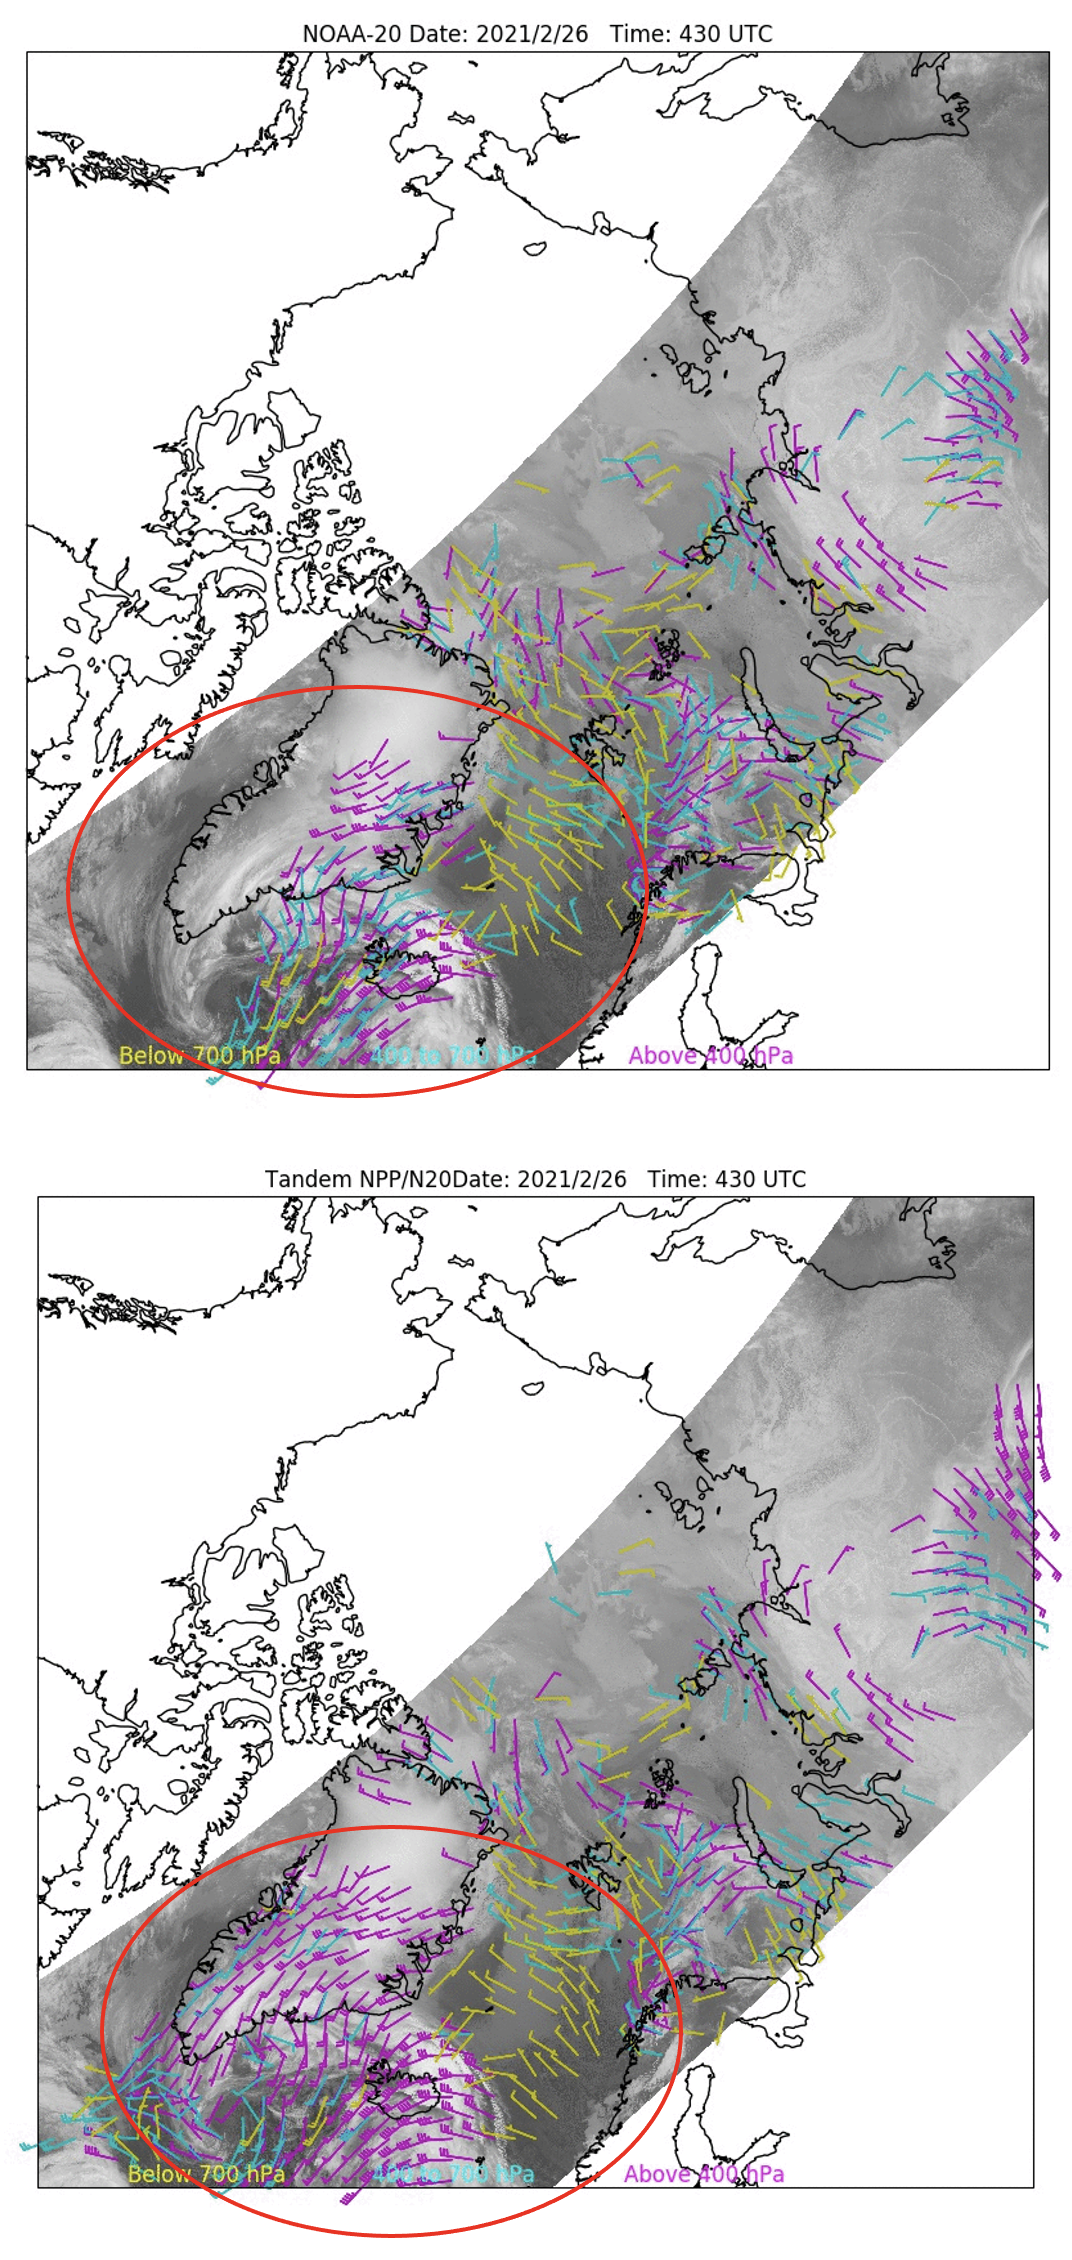
Tandem JPSS Winds Product Shows Enhanced Coverage: As of February 2021, the polar winds team at the Cooperative Institute of Meteorological Satellite Studies (CIMSS) is routinely generating the “tandem” NOAA-20/S-NPP atmospheric motion vector (AMV) product within the Enterprise Framework environment. This provides cloud motion wind observations over both the Arctic and Antarctic in near real-time. A case study of tandem AMV coverage is shown in the figure below. In this particular case there is a strong jet stream exit region of 40-50 knots pushing over Iceland at upper-levels (above 400 hPa, indicated by the magenta vectors). The area near Iceland exhibits ageostrophic motions and upper-level divergence. The tandem winds provide enhanced spatial coverage, in this case over West Greenland, the Labrador Sea, and south of Iceland in the anti-cyclonic part of the jet exit region. The greater coverage of the JPSS tandem AMV product is due to the greater overlap areas of preceding and succeeding S-NPP and NOAA-20 orbits, and the shorter time interval between them (50.5 versus 101 minutes). This demonstrates the ability of the experimental product to provide additional wind information that can be assimilated into global weather forecast models and downstream potential to make the weather models more accurate in forecasting atmospheric flow. Future work includes additional validation with radiosonde and aircraft data, and expanding the product into the mid-latitudes by including parallax correction and using a pair rather than a triplet of orbits. (R. Dworak, CIMSS, 608-265-8620; J. Key, E/RA2, 608-263-2605, jeff.key@noaa.gov; D. Santek, CIMSS, 608-263-7410)
 (Click image to enlarge)
Figure: Atmospheric Wind Vectors (AMVs) for the same date and time on 26 February 2021 at 0430 UTC over the Arctic and North Atlantic. Top: AMVs from NOAA-20 only. Bottom: AMVs from successive NOAA-20 and S-NPP overpasses. The area of interest in indicated by the red circle. Yellow AMVs are below 700 hPa; cyan are 400-700 hPa; and magenta are above 400 hPa.
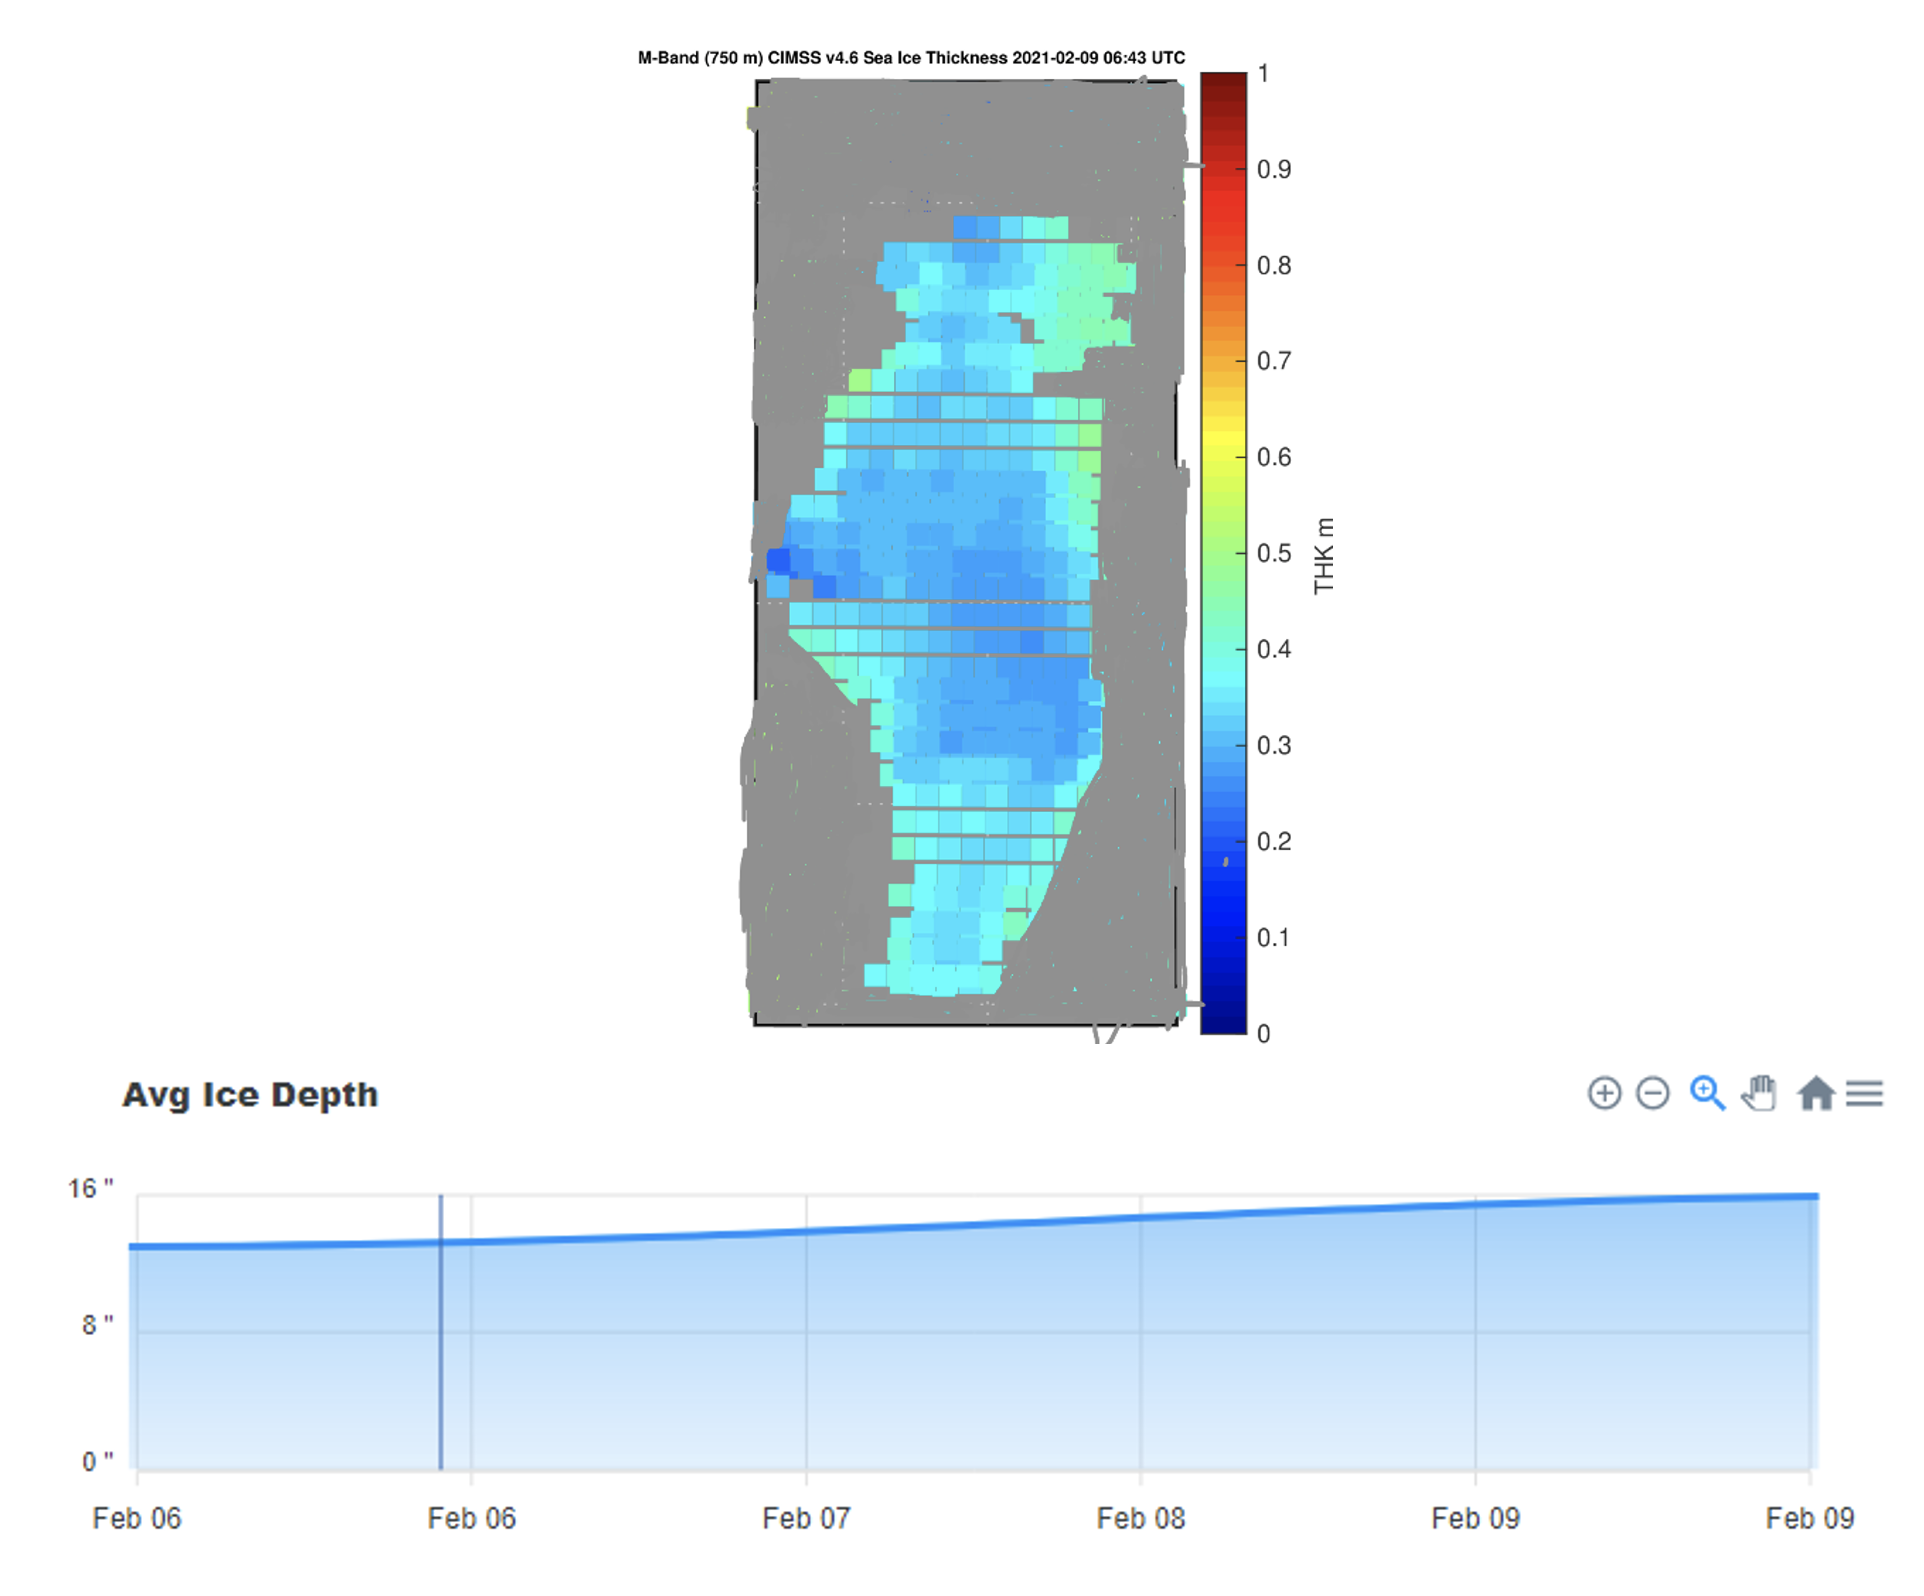
Ice thickness validation study over Lake Winnebago: While extensive validation of the VIIRS Ice Thickness and Age product has been done over Arctic sea ice, there has been relatively little in situ data over inland lakes that could be used to assess the accuracy of the product. On 9 February 2021, NOAA-20 VIIRS had good coverage over Wisconsin lakes. Lake Winnebago (Figure 1) is a popular location for ice fishing, where average ice depths are reported by anglers on a daily basis during the winter season. The latest version of the VIIRS ice thickness product, which uses the One-dimensional Thermodynamic Ice Model (OTIM) algorithm version 4.6, is shown in the figure below (top). Version 4.6 includes improvements in the residual heat flux estimation, ice thermal dynamic process (ice growth and melt), and physical dynamic process (ice rafting, ridging, and hammocking due to ice motion), especially along the Canadian Archipelago. The average depth reported by anglers over the period 6-9 February 2021 is also shown in the figure (bottom). By February 9, the average depth was close to 16 inches (0.4 meters). This observation closely matches the calculated ice thicknesses that are derived by OTIM version 4.6. Unfortunately, the current operational ice thickness product is observed to have a positive bias of 0.1 to 0.5 meters. The CIMSS Cryosphere team looks forward to implementing these improvements into operations as soon as possible. (R. Dworak, CIMSS, 608-265-8620; X. Wang, CIMSS, 608-261-1390; J. Key, E/RA2, 608-263-2605, jeff.key@noaa.gov)
 (Click image to enlarge)
Figure: Top: NOAA-20 VIIRS ice thickness (meters) over Lake Winnebago, Wisconsin on 2021-02-09 at 06:43 UTC using the updated ice thickness algorithm. Bottom: Average in situ ice depth measurements (inches) made by angers on Lake Winnebago, Wisconsin over the period 6-9 February 2021, with a range of 12-16” (0.3-0.4m). Information provided from Lake Winnebago - Wisconsin Fishing Reports and Discussions (lake-link.com).
AWARDS AND RECOGNITION:
PUBLICATIONS:
WORKSHOPS, CONFERENCES, AND MEETINGS:
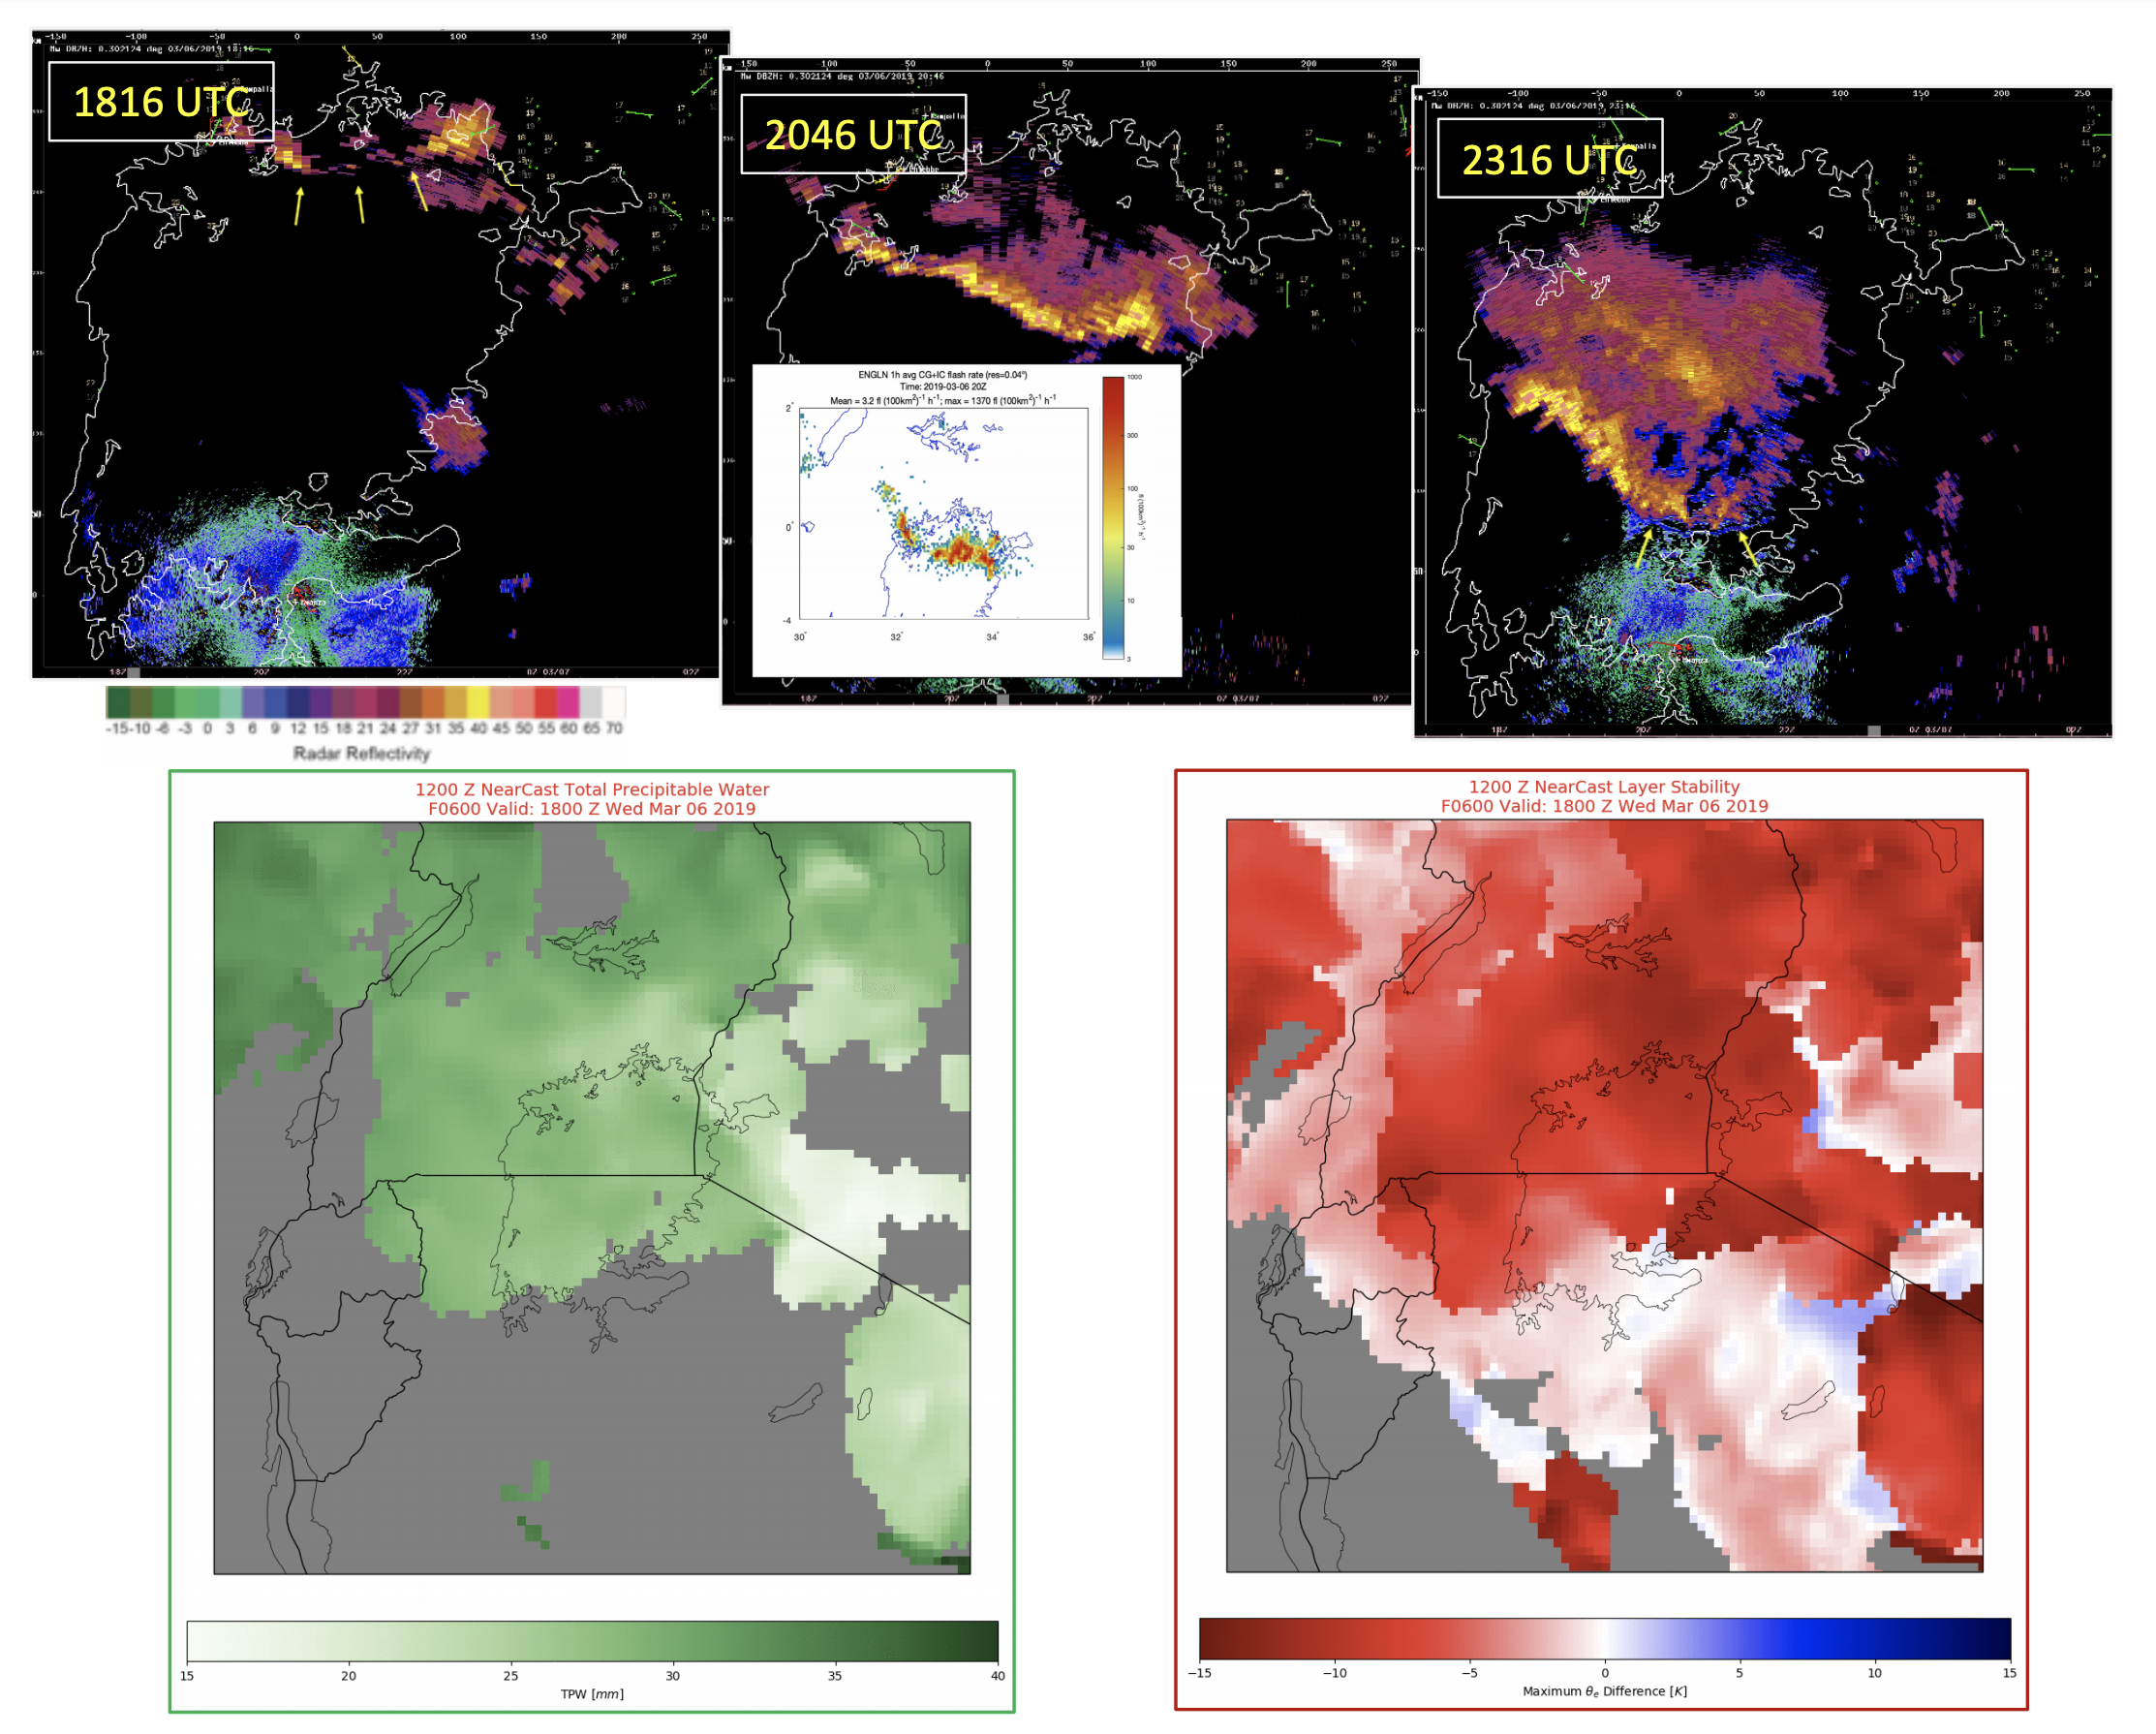
Participation in WMO Severe Weather Forecasting Program training for Africa: Ralph Petersen presented an invited lecture at the World Meteorological Organization (WMO) sponsored Severe Weather Forecasting Program (SWFP) forecaster training program for Tropical Equatorial African countries. His discussion centered on ways to improve short-range warning services in the area through increased use of Nowcasting tools. The talk focused specifically on the utility of the Cooperative Institute for Meteorological Satellite Studies (CIMSS) NearCast Model in extending the value of geostationary satellite observations about the pre-convective environment into very-short-range (1-9 hours) forecasts of when/where both local moisture sources and destabilization are likely to be maximized. (R. Petersen, CIMSS, 262-763-2583, L. Cronce, CIMSS, 608-265-6282)
 (Click image to enlarge)
Figure: Top: Radar imagery of thunderstorm developing rapidly along NE coast of LV on 6 March 2019, with accumulated lightning between first 2 radar images superimposed. Lower Left: Six-hour NearCast of derived Total Precipitable Water valid for 1800 UTC projects concentration of moisture over the NE portion of LV at time of initial radar signatures. Bottom: NearCast of deep-layer Stability (Right panel - defined as the vertical difference of Equivalent Potential Temperature,θe) valid at time of initial radar image showing high potential for convective development in region where convective instability is collocated with ample moisture supply over NE portion of LV shown in left panel.
TRAINING AND EDUCATION:
MEDIA AND OUTREACH:
SSEC and CIMSS Scientists in the News: Scientists at the University of Wisconsin-Madison (UW) Space Science and Engineering Center (SSEC) and the Cooperative Institute for Meteorological Satellite Studies (CIMSS) provide expert interviews, imagery and case studies to promote science. This week: 1) CIMSS scientist Scott Bachmeier contributed to a case study on the recent Arctic blast that brought sub-zero temperatures to many cities across the US. Shared by EUMETSAT, their analysis features RGB images from MODIS and GOES-16. Read more: https://www.eumetsat.int/arctic-blast-turned-us-white. 2) CIMSS Satellite Blog contributors Scott Bachmeier, Scott Lindstrom, and Tim Schmit published case studies on "Consolidation of ice within Green Bay" (Mar. 4), "NUCAPS moisture and cloud fields over the central Pacific Ocean" (Mar. 2), "Re-suspended ash from the Katmai volcano in Alaska" (Feb. 28), "Geostationary satellite views of the most rain over 72-hours in 2007" (Feb. 27), "Snow squalls in Montana" (Feb. 27), and "Using NUCAPS lapse rates to evaluate atmospheric stability" (Feb. 26). Read more: https://cimss.ssec.wisc.edu/satellite-blog/. (J. Phillips, SSEC, 608-262-8164, S. Bachmeier, CIMSS, S. Lindstrom, CIMSS, T. Schmit, E/RA2, 608-263-0291)
 (Click image to enlarge)
Figure: GOES-16 (GOES-East) visible images highlighted the wind-driven consolidation of ice on Green Bay, Mar. 3-4, 2021. Read more: https://cimss.ssec.wisc.edu/satellite-blog/archives/40117. Credit: CIMSS.
 (Click image to enlarge)
Figure: A retrospective analysis of infrared images from EUMETSAT's MET-8 shows record rain of 154.72" over Reunion Island, Feb. 25-27, 2007. Read more: https://cimss.ssec.wisc.edu/satellite-blog/archives/40074. Credit: CIMSS, NOAA, EUMETSAT.
OTHER:
| Archived Weeklies Page | Submit a report item |