[ Archive ]
| CIMSS-NOAA Weekly Report [ Archive ] |
CIMSS AND ASPB WEEKLY HIGHLIGHTS FOR THE WEEK ENDING AUGUST 13, 2021
PRODUCTS AND APPLICATIONS:
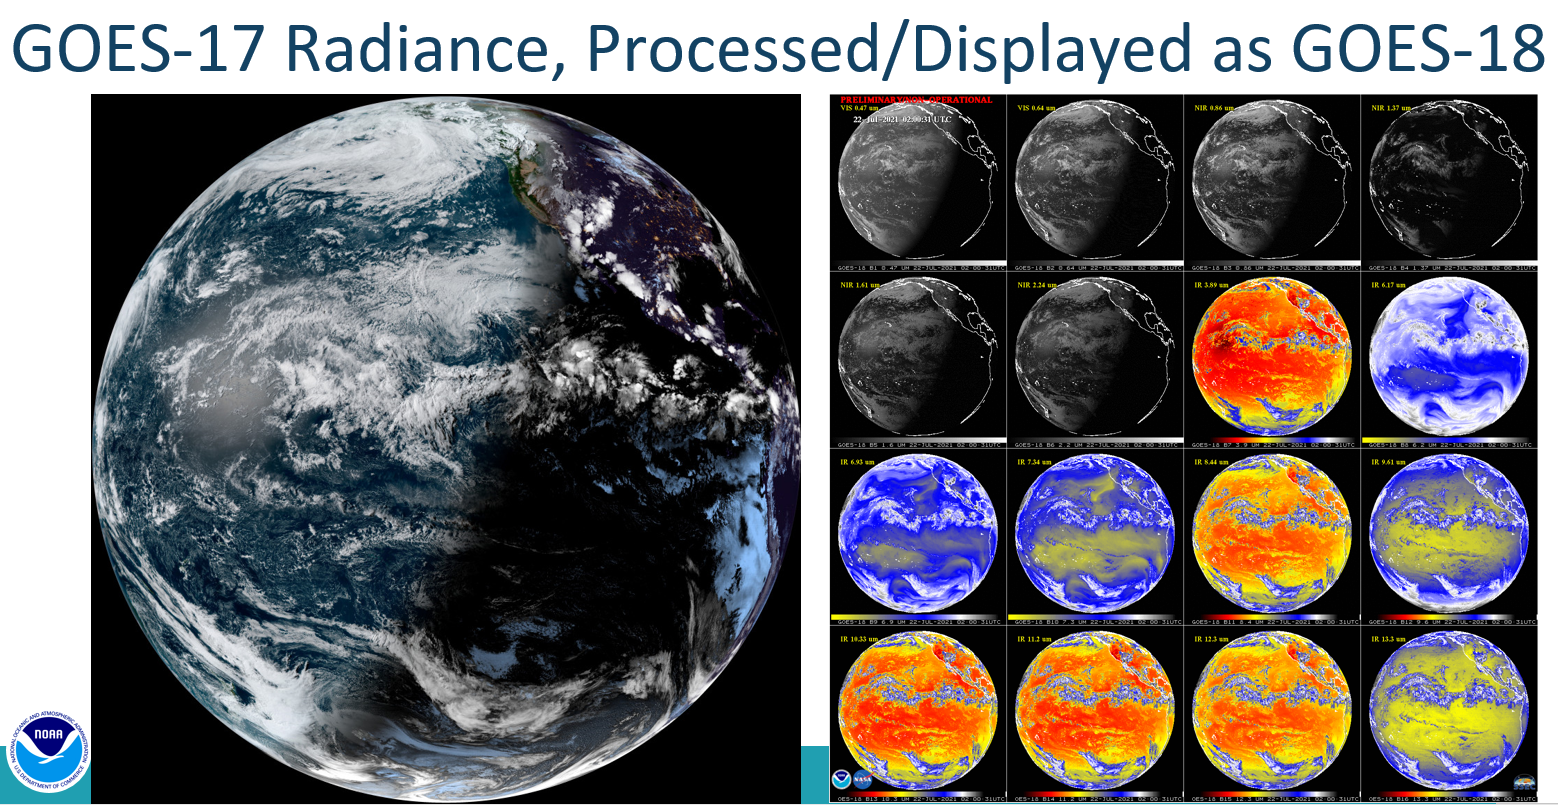
Images of "GOES-18" DOE Data: The Product Readiness and Operations Team and others produced a dataset of Geostationary Operational Environmental Satellite (GOES)-18 Advanced Baseline Imager (ABI) radiances using observed GOES-17 radiances as input. The “GOES-18” ABI radiances were part of a recent Data Operations Exercise (DOE)-2. The radiances that were processed as GOES-18 were then successfully displayed by the Algorithm Working Group (AWG) Imagery Team in a number of software systems for a given day and time. This effort is to better prepare for GOES-T/18 first light imagery. (T. Schmit, E/RA2, 608-263-0291)
 (Click image to enlarge)
Figure: A GOES-17 Full Disk image, processed as GOES-18, of geocolor (by CIRA) and a multi-panel image of all ABI spectral bands (by UW/CIMSS).
AWARDS AND RECOGNITION:
PUBLICATIONS:
Paper using CIMSS NearCasts over Africa published in BAMS: A paper entitled "Taking the HIGHWAY to save lives on Lake Victoria" has been accepted for publication in the Bulletin of the American Meteorological Society. Attached to the paper is a supplement that highlights video loops available to local forecasters showing NearCast projections of moisture products and stability estimates derived from METEOSAT observations. Ralph Petersen and Lee Cronce of the Cooperative Institute for Meteorological Satellite Studies (CIMSS) were both co-authors on the paper. (R. Petersen, CIMSS, 262-763-2583, L. Cronce, CIMSS, 608-265-6282).
 (Click image to enlarge)
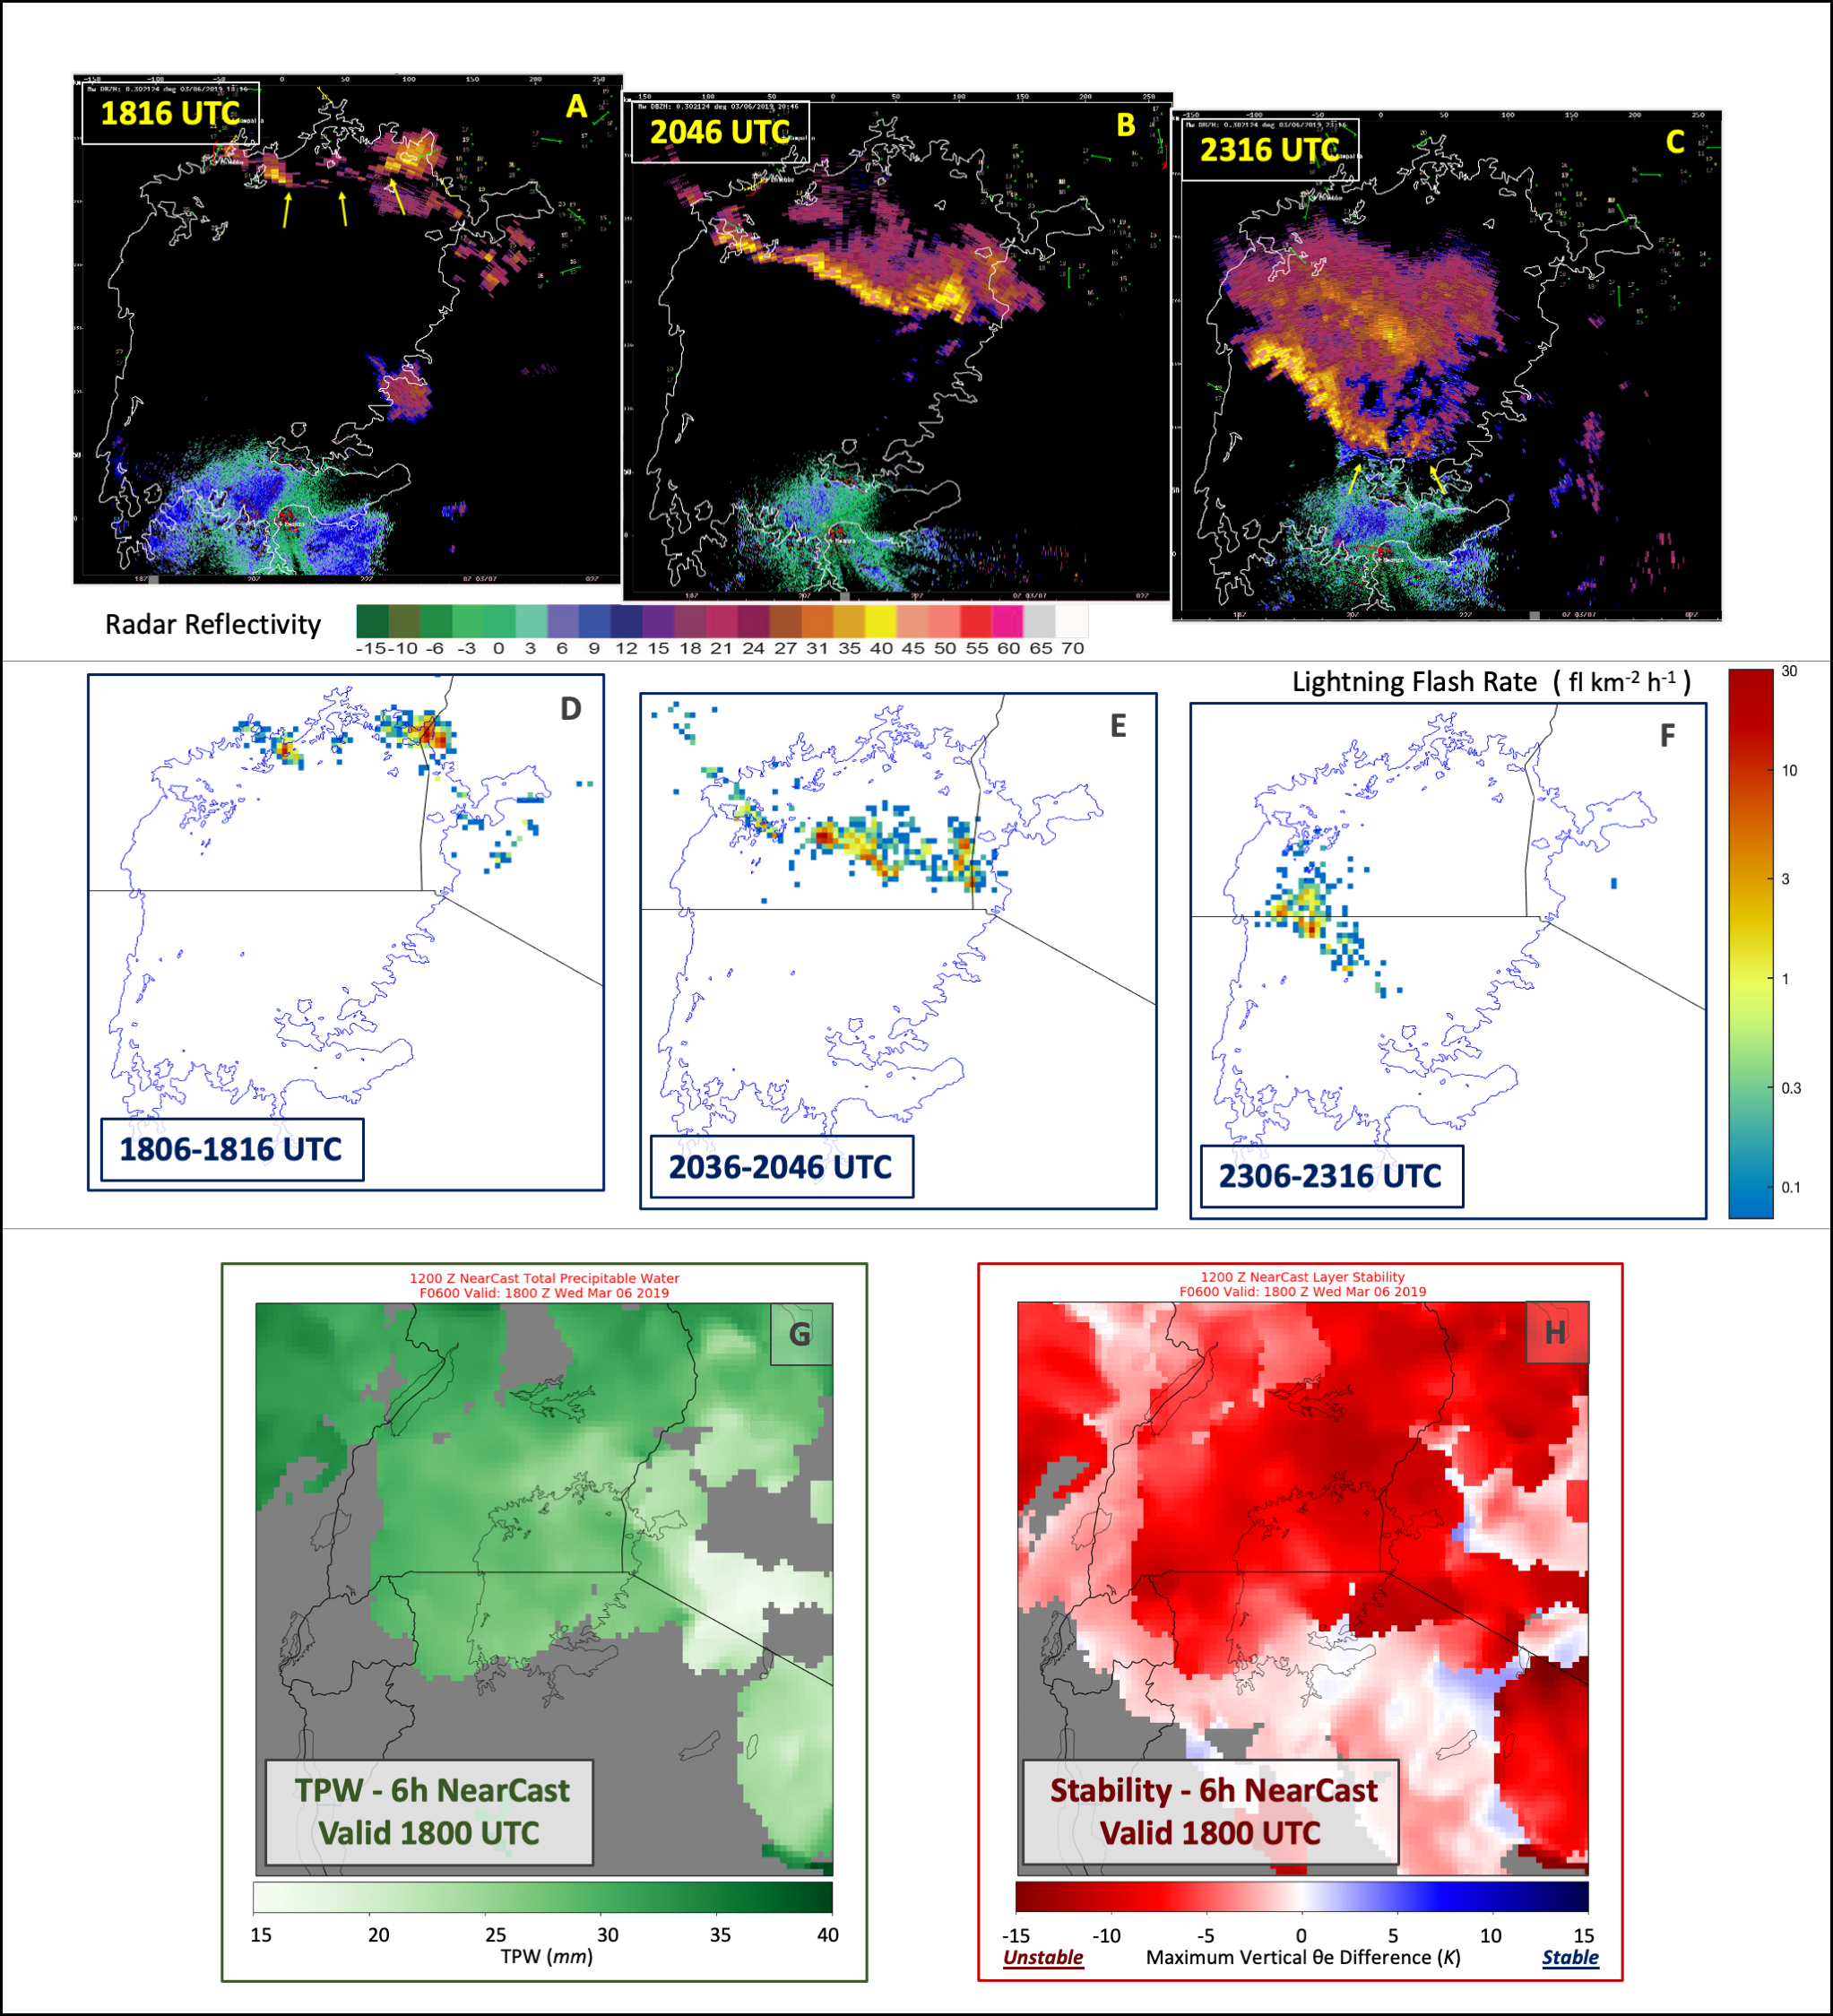
Figure: Panels A-C: Progression of Mwanza radar imagery of thunderstorms developing rapidly along NE coast of LV for 5 hours after 1816 UTC (2116 LT) on 6 March 2019. Arrows indicate location of new storms. Panels D-F: Earth Networks Global Lightning Network (ENGLN) total (IC + CG) lightning flash density (fl km-2h-1) on a density grid of 0.04° (compatible with the TA4 model grids) accumulated over 10 minute periods prior to the time of radar images in Panels A-C. Panel G: Six-hour NearCast projections of Total Precipitable Water valid at 1800 UTC showing concentration of moisture over the NE portion of LV at the time of initial radar signatures. Panel H: NearCast of deep-layer Stability (defined here as the vertical difference of Equivalent Potential Temperature, θe) showing unstable conditions developing in region of ample moisture supply noted in Panel G.
WORKSHOPS, CONFERENCES, AND MEETINGS:
TRAINING AND EDUCATION:
VISIT Training on NUCAPS Profiles: Scott Lindstrom from the Cooperative Institute for Meteorological Satellite Studies (CIMSS) provided Virtual Institute for Satellite Integration Training (VISIT) instruction on NOAA-Unique Combined Atmospheric Processing System (NUCAPS) profiles that are available for situational awareness in National Weather Service forecast offices. The 30-minute training (via WebEx) was provided to a new hire at the NWS forecast office in Wichita KS. (Scott Lindstrom, CIMSS, 608 263 4425)
MEDIA AND OUTREACH:
SSEC and CIMSS Scientists in the News: Scientists at the University of Wisconsin-Madison (UW) Space Science and Engineering Center (SSEC) and the Cooperative Institute for Meteorological Satellite Studies (CIMSS) provide expert interviews, imagery and case studies to promote science. This week: 1. CIMSS Satellite Blog contributors Scott Lindstrom, Scott Bachmeier published case studies on "Tropical Depression Fred north of Cuba" (Aug. 12), "One month of Day Night Band imagery over the Dixie Fire in California" (Aug. 12), "GOES-14 is brought out of storage" (Aug. 11), "Tropical Storm Fred in the Caribbean Sea" (Aug. 11), "Monitoring Convection as it develops with NUCAPS" (Aug. 10), "Severe weather over northeast Illinois" (Aug. 9), "SAR winds over Tropical Storm Mirinae" (Aug. 8), and "Transverse banding associated with a decaying Mesoscale Convective System" (Aug. 7). Read more: https://cimss.ssec.wisc.edu/satellite-blog/. (J. Phillips, SSEC, 608-262-8164, S. Lindstrom, CIMSS, S. Bachmeier, CIMSS, T. Schmit, E/RA2)
 (Click image to enlarge)
Figure: Sequence of Infrared images from EWS-G1 (formerly GOES-13), GOES-17, GOES-15, GOES-14 and GOES-16 on Aug. 11, 2021 captured during the annual checkout activities for GOES-14. These data were accessed through SSEC's Satellite Data Services. Read more at the CIMSS Satellite Blog: https://cimss.ssec.wisc.edu/satellite-blog/archives/41884. Credit: CIMSS, NOAA.
 (Click image to enlarge)
Figure: Animation of VIIRS Day Night Band imagery over northern California, July 9 - August 12, 2021, showing the development, expansion and motion of the Dixie Fire. The animation was derived from 1-km resolution imagery. Read more at the CIMSS Satellite Blog: https://cimss.ssec.wisc.edu/satellite-blog/archives/41886. Credit: CIMSS.
OTHER:
| Archived Weeklies Page | Submit a report item |