[ Archive ]
| CIMSS-NOAA Weekly Report [ Archive ] |
CIMSS AND ASPB WEEKLY HIGHLIGHTS FOR THE WEEK ENDING SEPTEMBER 2, 2022
DATA, INFORMATION, AND USE-INSPIRED SCIENCE:
NOAA-20 VIIRS-AMSR2 Blended Sea Ice Concentration Product Observes Opening in Northern Passage: On 29 August 2022, the NOAA-20 VIIRS-AMSR2 blended SIC product observed the opening of the Northern Sea Route of the Northwest Passage (Figure 1a). A map showing this route is shown in Figure 1b. A false color RGB image using NOAA-20 VIIRS Imagery bands channels 1 (0.64 µm on blue), 2 (0.865 µm on green), and 3 (1.61 µm on red) at 19:40 UTC on the same day confirms the opening of the passage (Figure 1c). This is a notable occurrence, but not the first time observed during the satellite era, when the last time that this route was open by this date was in 2011 and the last time this route was open was in September 2015. (R. Dworak, CIMSS, 608-265-8620)
 (Click image to enlarge)
Figure 1: a) The blended VIIRS-AMSR2 Sea Ice Concentration (0-100%) using NOAA-20 b) A map that shows the geographic routes to the Northwest Passage c) False color NOAA-20 VIIRS Imager band RGB (I3-I2-I1) at 19:40 UTC on 2022-08-29 (dark areas are open water with cyan being surface sea ice).
CIMSS Develops Barcode Striping Monitoring Tool: Researchers at the Cooperative Institute for Meteorological Satellite Studies (CIMSS) developed a tool for monitoring noise in band 07 of the GOES-18 Advanced Baseline Imager (ABI). GOES-18 ABI Band 07 (the 3.9 micrometer band) has a small amount of noise that has been referred to as "barcode noise" since it appears as vertical stripes. The effect is subtle, but can be seen in certain enhancements or when doing band differences. CIMSS developed a web tool so that the satellite operators and others can monitor the noise and the impacts of any mitigation steps they make in realtime imagery. The web tool can be accessed here and the user can change the date as needed: https://bit.ly/3e828W8. (M. Gunshor, CIMSS, matg@ssec.wisc.edu, T. Schmit, E/RA2, 608-263-0291, tim.j.schmit@noaa.gov)
 (Click image to enlarge)
Figure: Time-difference imagery (previous time step image subtracted from current time step image) for GOES-18 ABI Band 07 which makes the so-called "Barcode Noise" vertical stripes in that band's data exaggerated and easily detectable (September 1, 2022 12:06 UTC - 12:01 UTC).
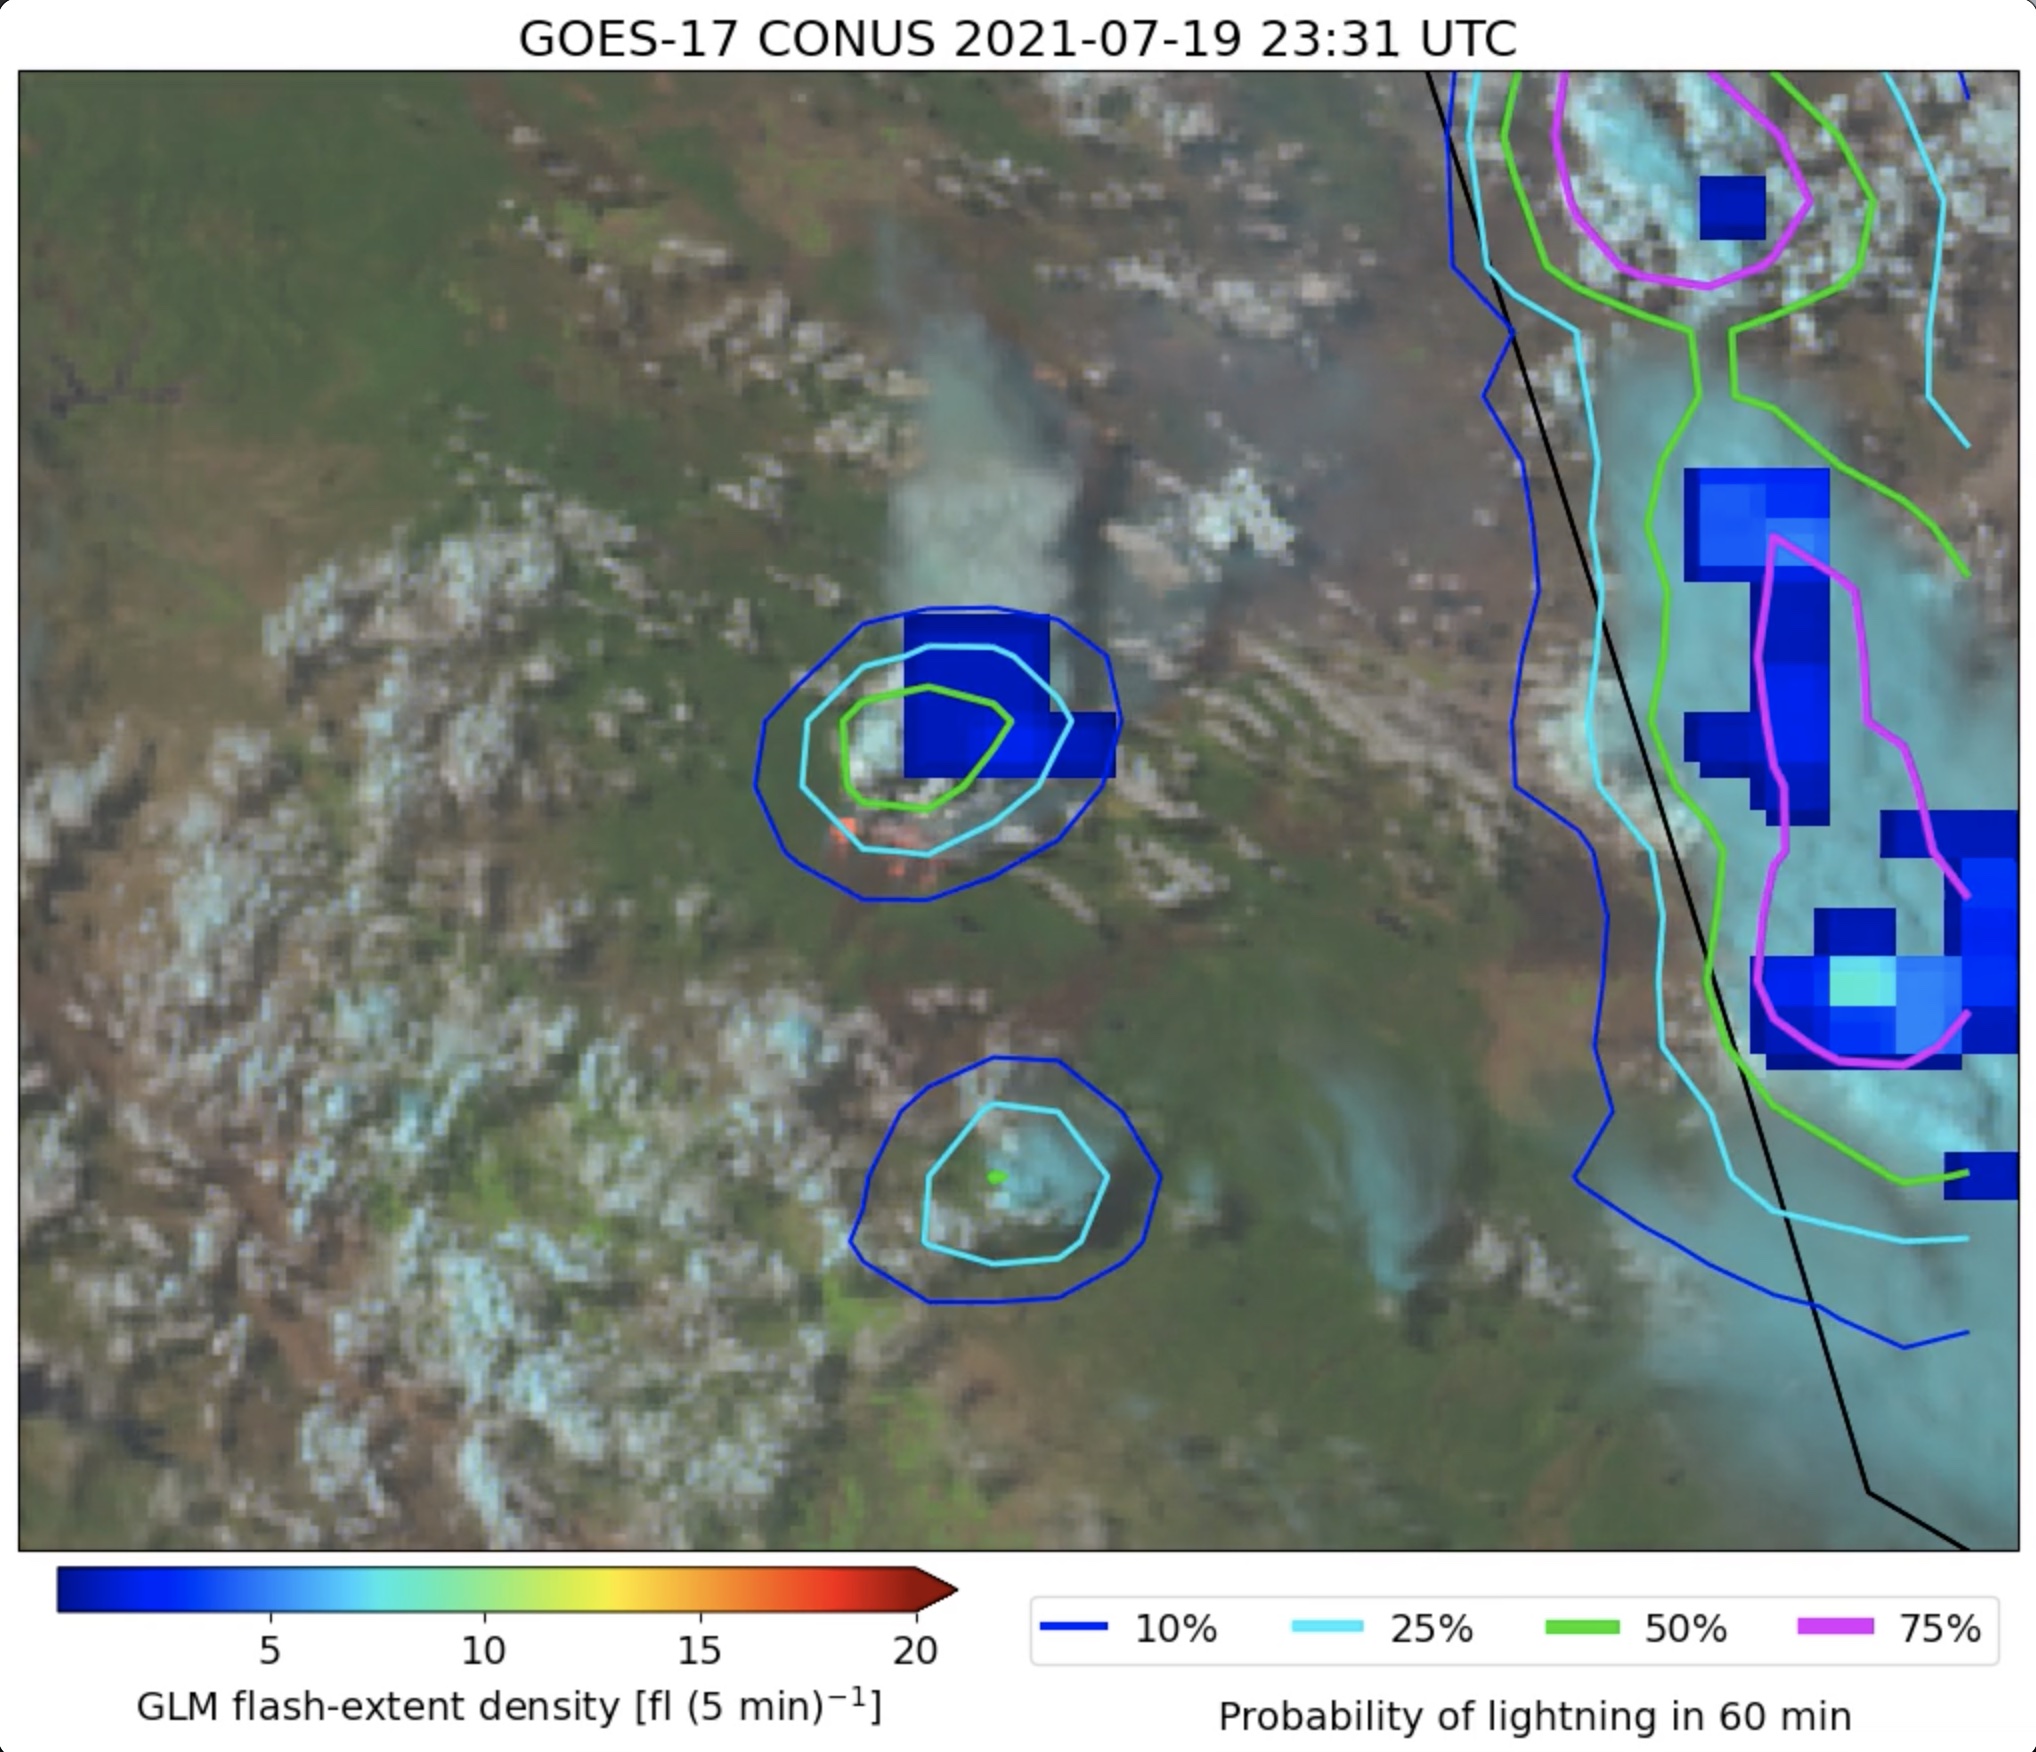
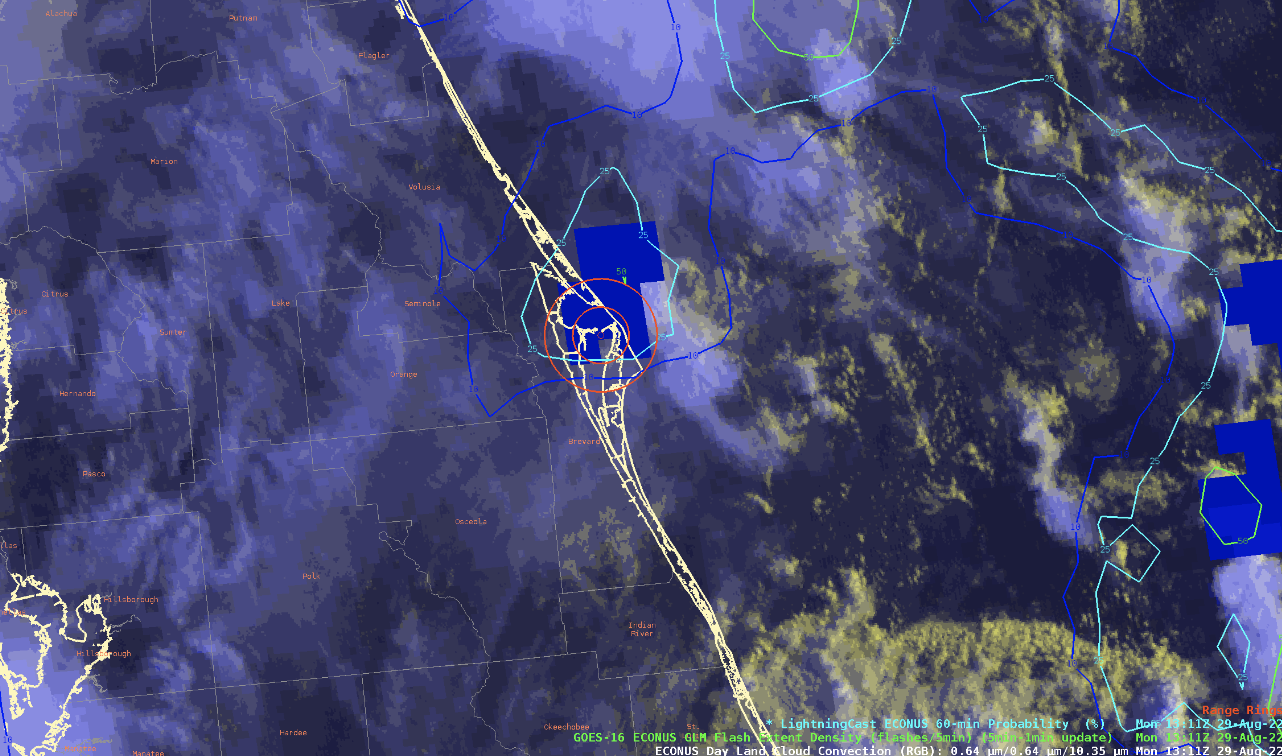
Dixie Fire PyroCu and LightningCast: A forecaster from the Western Region of the National Weather Service (NWS) brought the use of ProbSevere LightningCast for fire-incident monitoring to the attention of personnel at the Cooperative Institute for Meteorological Satellite Studies (CIMSS). The forecaster showed how LightningCast (a deep-learning model that uses GOES-R ABI data to predict next-hour lightning) could be used by incident meteorologists (IMETs) to provide guidance to emergency managers for the monitoring of possible new fire-ignition zones, as well as to help protect wildfire fighters from lightning. The Dixie fire from 19-20 July of 2021 was used as an example, where LightingCast showed an elevated probability of lightning on a developing pyrocumulonimbus before lightning was observed. CIMSS updated their blog post on the pyrocumulonimbus cloud from the Dixie fire, showing output from LightningCast using GOES-17 ABI inputs. (J. Cintineo, CIMSS, cintineo@wisc.edu; S. Bachmeier, CIMSS, scott.bachmeier@ssec.wisc.edu; M. Pavolonis, E/RA2, 608-263-9597 michael.pavolonis@noaa.gov)
 (Click image to enlarge)
Website with ASCAT winds over the past week created for Pacific Region: At the request of the NWS Weather Service Office (WSO) in Pago Pago, Scott Lindstrom from the Cooperative Institute for Meteorological Satellite Studies has created a wind website (https://www.ssec.wisc.edu/~scottl/Windspeed/PacificRegionWinds.html) that shows a week's worth of advanced scatterometer (ASCAT) data from both MetopB and MetopC satellites. This supplements a previously-developed website that shows a week's worth of Altimetric wave data over the Pacific Region (https://www.ssec.wisc.edu/~scottl/Waveheight/PacificRegionWaves.html). Data at both websites are refreshed daily to show the previous 7 days' worth of data, and include sectors that cover domains for WSO Pago Pago as well as WFO Guam and WFO Honolulu. These websites have also been shared with the Weather Service in Samoa. (S. Lindstrom, CIMSS, 608 263 4425).
FUTURE OUTLOOK:
AWARDS AND RECOGNITION:
TRAVEL AND MEETINGS:
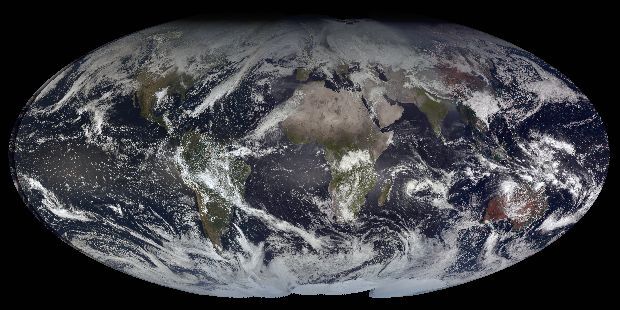
CIMSS/SSEC participation in the 2022 NOAA Science On a Sphere (SOS) Conference: Margaret Mooney from NOAA's Cooperative Institute for Meteorological Satellite Studies (CIMSS) and Rick Kohrs from the Space Science and Engineering Center (SSEC) participated and presented in the NOAA Science On a Sphere (SOS) Users Collaborative Network Workshop August 30 to September 1, 2022. Kohrs presented "Big Blue Marble from Geostationary Orbit" and Mooney presented "Extending the Benefits of a NOAA Educational Grant". More details can be found at https://www.noaa.gov/office-education/sosnetwork/workshops/2022-workshop. (M. Mooney, CIMSS, margaret.mooney@ssec.wisc.edu, R. Kohrs, SSEC)
 (Click image to enlarge)
Figure: “Big Blue Marble” via five geostationary satellites.
TRAINING AND EDUCATION:
MEDIA INTERACTIONS AND REQUESTS:
SOCIAL MEDIA AND BLOG Posts:
SSEC and CIMSS Scientists in the News: Scientists at the University of Wisconsin-Madison (UW) Space Science and Engineering Center (SSEC) and the Cooperative Institute for Meteorological Satellite Studies (CIMSS) provide expert interviews, imagery and case studies to promote science. This week: 1. CIMSS researchers Mike Foster and Coda Phillips contributed to The State of the Climate in 2021 by analyzing global cloudiness records from the NASA Aqua satellite. Their findings showed that 2021 was the third cloudiest year since 2003 (see pS59-S61): https://ametsoc.net/sotc2021/StateoftheClimate2021_lowres.pdf. 2. Matthew Lazzara, Taylor Norton and Linda Keller, researchers with the UW-Madison Antarctic Meteorological Research and Data Center, contributed to The State of the Climate in 2021, reporting on Antarctic conditions, including the coldest measured average temperature at the South Pole in 2021 (see pS313-S321, link above). 3. CIMSS Satellite Blog contributors Scott Lindstrom, Scott Bachmeier and John Cintineo published these case studies: "LIS observations over Typhoon Hinnamnor" (Sept. 1), "Super Typhoon Hinnamnor once again reaches Category 5 intensity" (Aug. 31), "Using CSPP Quicklooks software to show multiple NUCAPS passes" (Aug. 31), "Super Typhoon Hinnamnor in the West Pacific" (Aug. 29), and "LightningCast and Cape Canaveral" (Aug. 29). Read more at the CIMSS Satellite Blog: https://cimss.ssec.wisc.edu/satellite-blog/. (M. Foster, CIMSS, C. Phillips, CIMSS, M. Lazzara, SSEC, T. Norton, SSEC, L. Keller, SSEC, S. Lindstrom, CIMSS, S. Bachmeier, CIMSS, J. Cintineo, CIMSS, J. Phillips, SSEC, 608-262-8164)
 (Click image to enlarge)
Figure: Images from the Japan Meteorological Agency's Himawari-8 showed Typhoon Hinnamnor as it reached Category 5 intensity on August 31, 2022. Read more at the CIMSS Satellite Blog: https://cimss.ssec.wisc.edu/satellite-blog/archives/47705. Credit: CIMSS, JMA.
 (Click image to enlarge)
Figure: The AI model, ProbSevere LightningCast, predicted elevated probabilities of lightning near Kennedy Space Center on Aug. 29, 2022 prior to the launch window for the Artemis rocket (later scrubbed), reaching nearly 60% by 12:31 UTC. The Geostationary Lightning Mapper observed lightning about 40 minutes later. Read more at the CIMSS Satellite Blog: https://cimss.ssec.wisc.edu/satellite-blog/archives/47675. Credit: CIMSS, NOAA.
PUBLICATIONS:
OTHER:
| Archived Weeklies Page | Submit a report item |