[ Archive ]
| CIMSS-NOAA Weekly Report [ Archive ] |
CIMSS-NOAA WEEKLY HIGHLIGHTS FOR THE WEEK ENDING DECEMBER 1, 2023
DATA, INFORMATION, AND USE-INSPIRED SCIENCE:
FUTURE OUTLOOK:
AWARDS AND RECOGNITION:
TRAVEL AND MEETINGS:
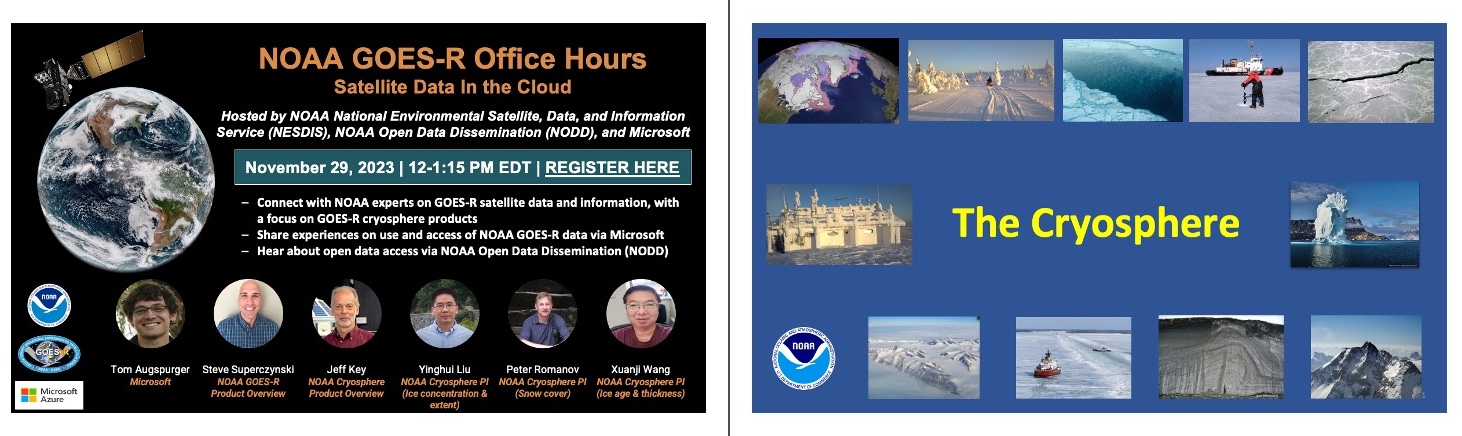
NOAA Office Hours featuring snow and ice products by GOES-R, NODD, and Microsoft: On November 29, 2023, NOAA held the fifth in a series of NOAA Open Data Office Hours. This particular event was titled "NOAA GOES-R Satellite Data In The Cloud". It was a collaboration between GOES-R, NOAA Open Data Dissemination (NODD), and Microsoft, with the purpose of introducing users to the three operational GOES-R Cryosphere products: Ice Concentration and Extent, Ice Age and Thickness, and Snow Cover. The Office Hours concept provides an opportunity for NOAA data users to interact with NOAA subject matter experts. NODD disseminates NOAA data on the cloud, utilizing partnerships with Microsoft Azure, Amazon Web Services, and Google Cloud. These partnerships enable interoperability and provide full and open access with no egress costs. NODD hosts GOES-R on all three cloud platforms. See the NODD website for more information on data availability and the Office Hours events. Jeff Key, Yinghui Liu (both STAR), Peter Romanov (CREST/CUNY), and Xuanji Wang (CIMSS) gave presentations on the snow and ice products. Over 50 people worldwide participated in the event. (J. Key, E/RA2, 608-263-2605, jeff.key@noaa.gov; Y. Liu, E/RA2, 608-890-1893, yinghui.liu@noaa.gov; X. Wang, CIMSS, 608-261-1390)
 (Click image to enlarge)
Figure: NOAA Office Hours announcement (left) and title slide (right) for the cryosphere presentations.
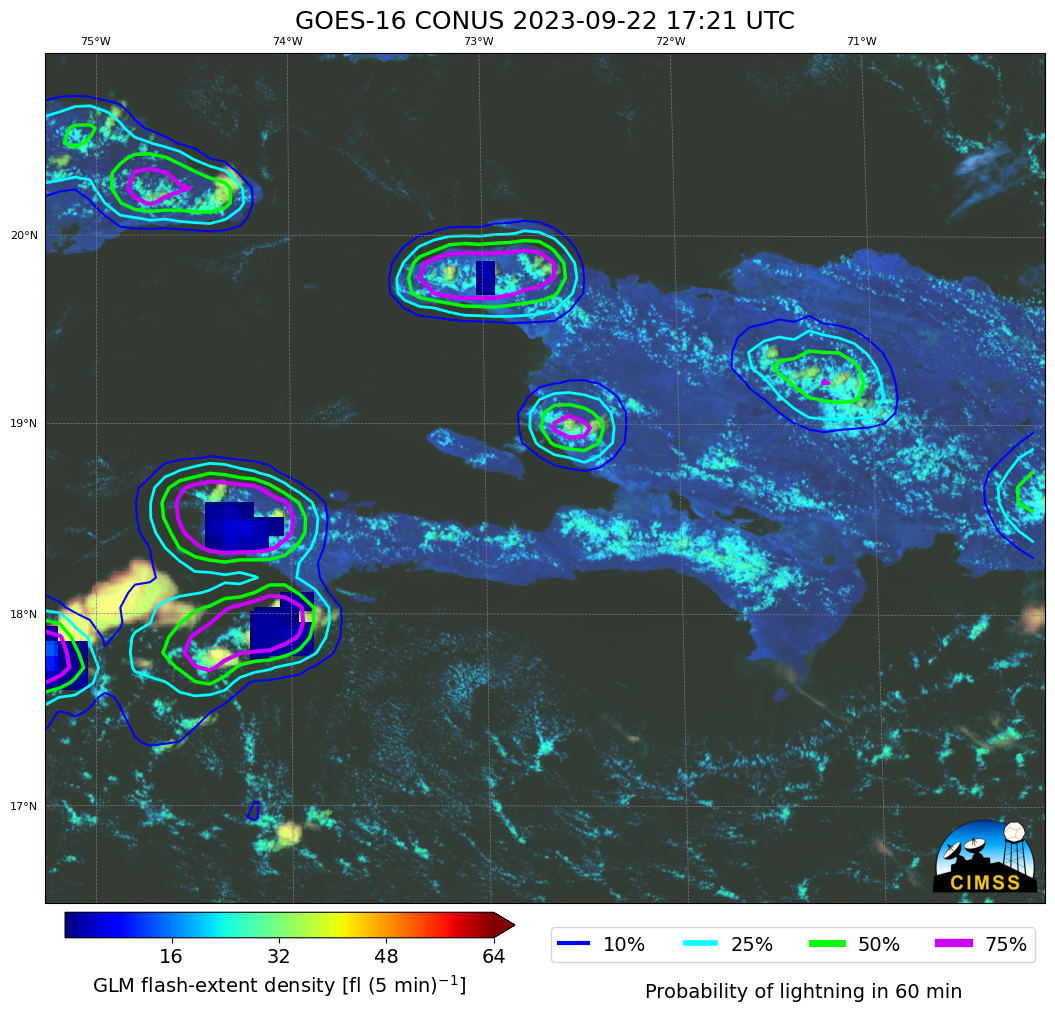
Invited presentation at WMO Aviation Workshop for RA-IV: John Cintineo of the Cooperative Institute for Meteorological Satellite Studies presented at the World Meteorological Organization (WMO) Aviation Workshop for Regional Association IV (RA-IV), which includes nations from North America and the Caribbean Sea. Forecasters from South America were also present. The primary goal of the workshop was to improve Significant Meteorological Information advisory (SIGMET) availability and accuracy by reviewing current practices, learning new techniques, and strengthening the collaboration and coordination between National Meteorological and Hydrological Services (NMHS). John's presentation focused on using output from the artificial intelligence (AI) models of ProbSevere LightningCast and IntenseStormNet. LightningCast is an AI model that uses images of GOES-R Advanced Baseline Imager (ABI) data to predict the probability of lightning in the next hour. IntenseStormNet is also an AI model that uses images of GOES-R ABI and Geostationary Lightning Mapper (GLM) to detect and predict the most "intense" parts of storms, where hail, severe wind gusts, and tornadoes may occur. Participants were particularly interested in the time series capability of LightningCast for locations in their countries. (J. Cintineo, CIMSS, john.cintineo@ssec.wisc.edu)
 (Click image to enlarge)
Figure: LightningCast predictions (contours) near the nation of Haiti. Background is GOES-16 ABI day-cloud-phase-distinction RGB and blue foreground pixels are GOES-16 GLM flash-extent density observations. LightningCast predicts much of this orographically forced convection before the first GLM flashes.
TRAINING AND EDUCATION:
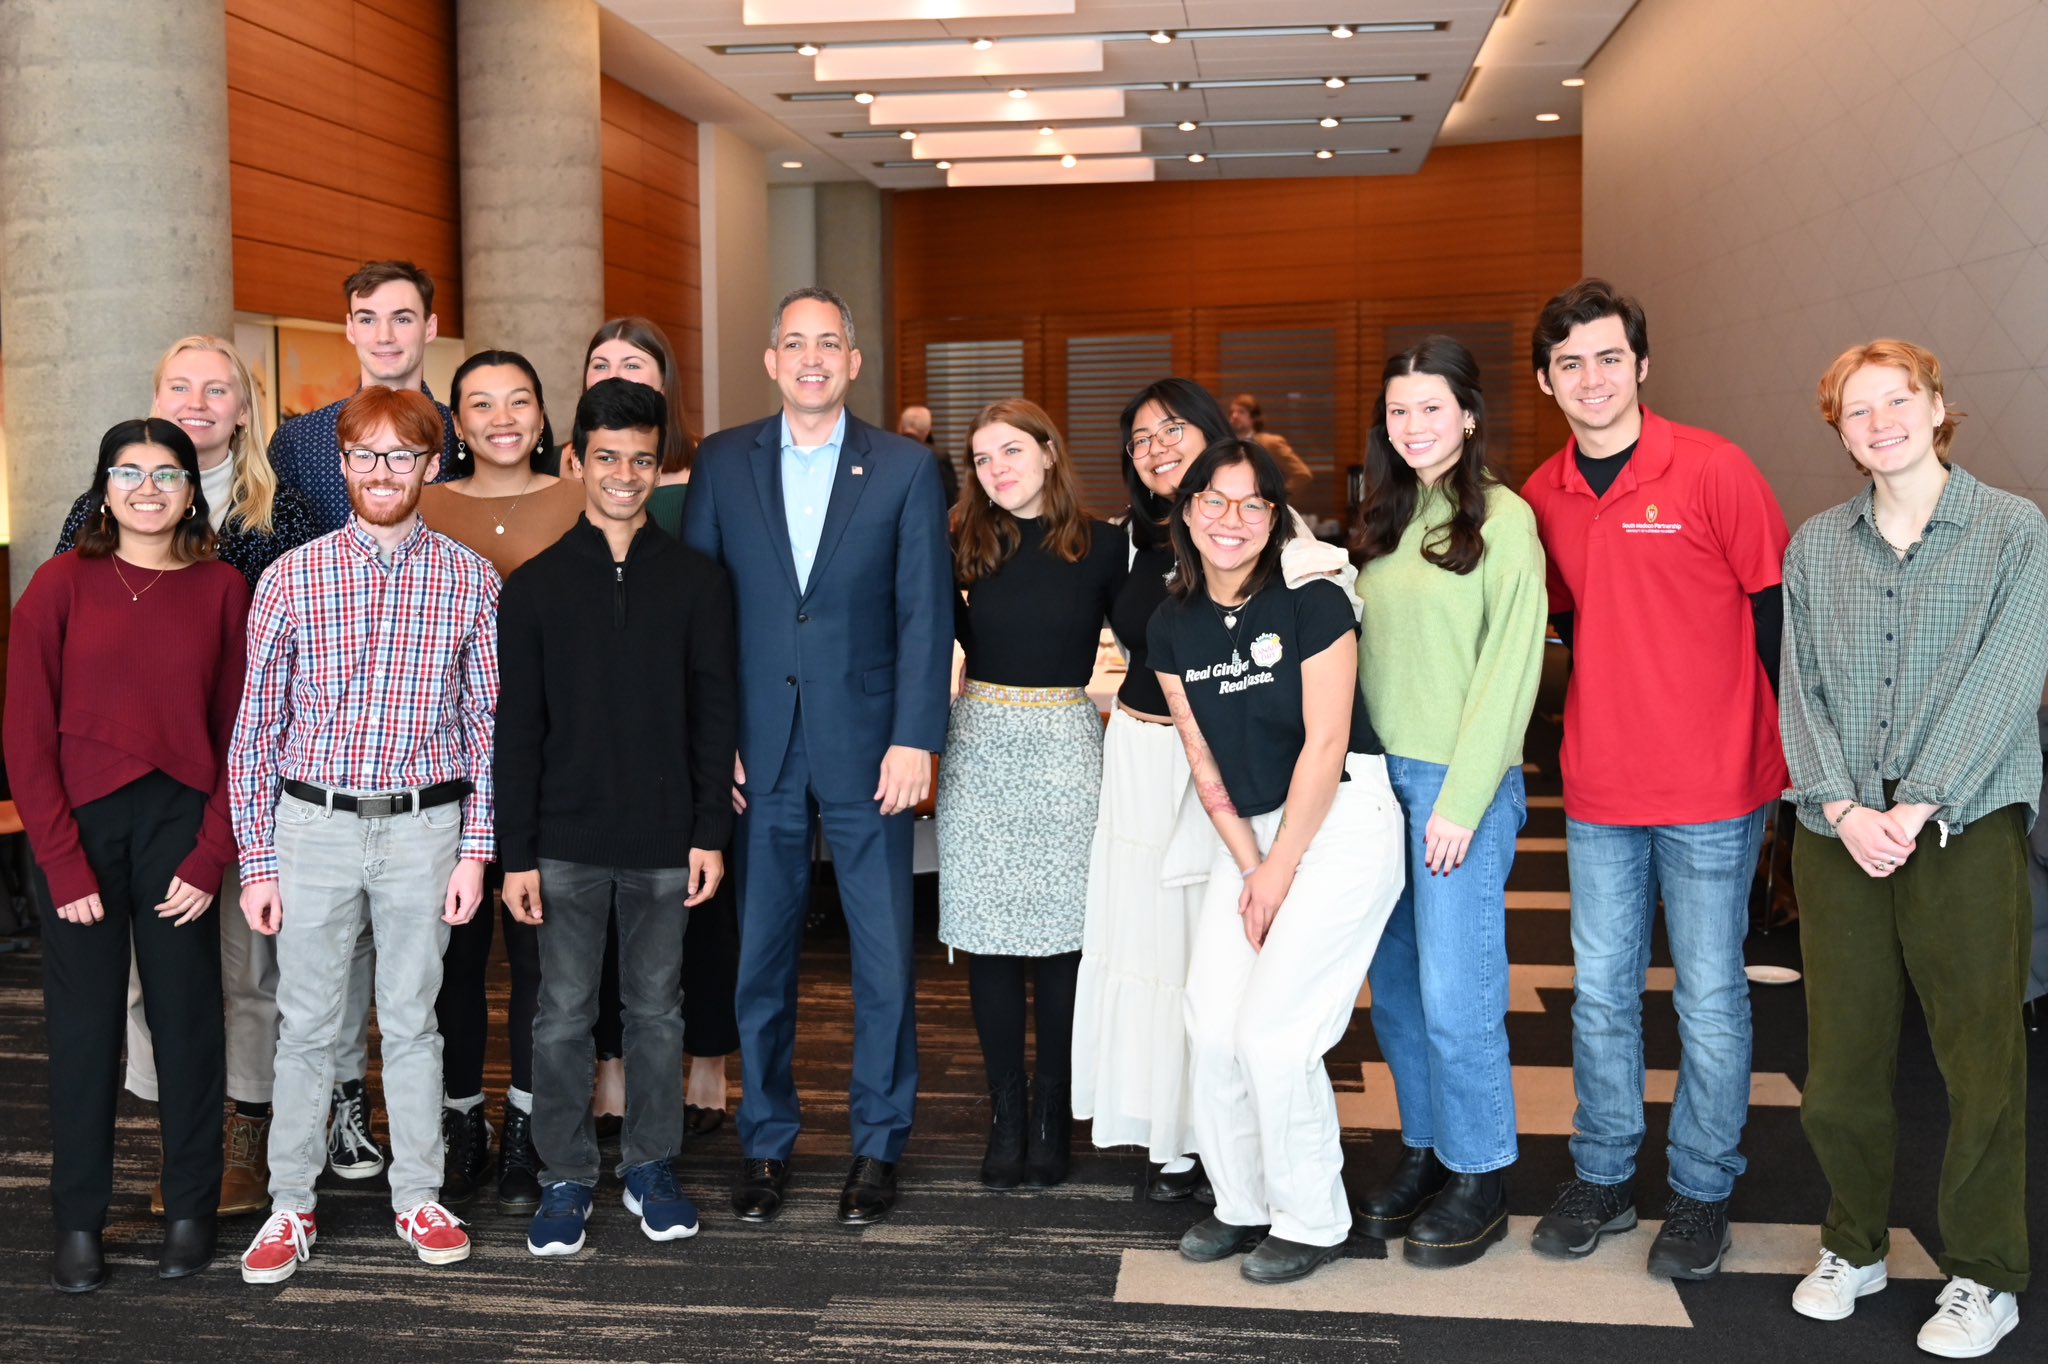
DOC Deputy Secretary Graves conducts climate roundtable at the UW-Madison: On Thursday November 30th DOC Deputy Secretary Don Graves met with several undergraduates at the University of Wisconsin-Madison (UW) to collect their thoughts on the climate crisis as part of the Biden-Harris Administration’s commitment to address climate change and do so equitably. NOAA's Cooperative Institute for Meteorological Satellite Studies (CIMSS) helped identify students for the event from a UW course where students are tasked to share their thoughts in short videos, available online at https://cimss.ssec.wisc.edu/education/AOS102/. (M. Mooney, CIMSS, margaret.mooney@ssec.wisc.edu)
 (Click image to enlarge)
Figure: DOC Deputy Secretary surrounded by UW undergraduate students.
MEDIA INTERACTIONS AND REQUESTS:
SOCIAL MEDIA AND BLOG Posts:
SSEC and CIMSS Scientists in the news: Scientists at the University of Wisconsin-Madison (UW) Space Science and Engineering Center (SSEC) and the Cooperative Institute for Meteorological Satellite Studies (CIMSS) provide expert interviews, imagery and case studies to promote science. This week: 1) CIMSS Satellite Blog contributor Scott Bachmeier, Scott Lindstrom, and Alexa Ross published the following case studies: "Kona Low developing over Hawai’i" (Nov. 29), "Iceberg A23a in the Antarctic Ocean" (Nov. 29), "Lake Erie lake efect snow band produces thundersnow south of Buffalo NY" (Nov. 27), "Assessing fire and smoke in Louisiana with RealEarth" (Nov. 27), "Using CSPP’s polar2grid to create mappings of sea-surface temperature" (Nov. 27), "LightningCast Probability use in the South Pacific" (Nov. 27). Read more at the CIMSS Satellite Blog: https://cimss.ssec.wisc.edu/satellite-blog/. (S. Lindstrom, CIMSS, 608-263-4425, S. Bachmeier, CIMSS, A. Ross, CIMSS, 608-263-6765, E. Verbeten, SSEC, 608-263-4206)
(Click image to enlarge)
Figure: 10-minute interval GOES-16 (GOES-East) True Color RGB images from 0930-1900 UTC on 13-26 November 2023 showed Iceberg A23a just east-northeast of Joinville Island (at the tip of the Antarctic Peninsula).
PUBLICATIONS:
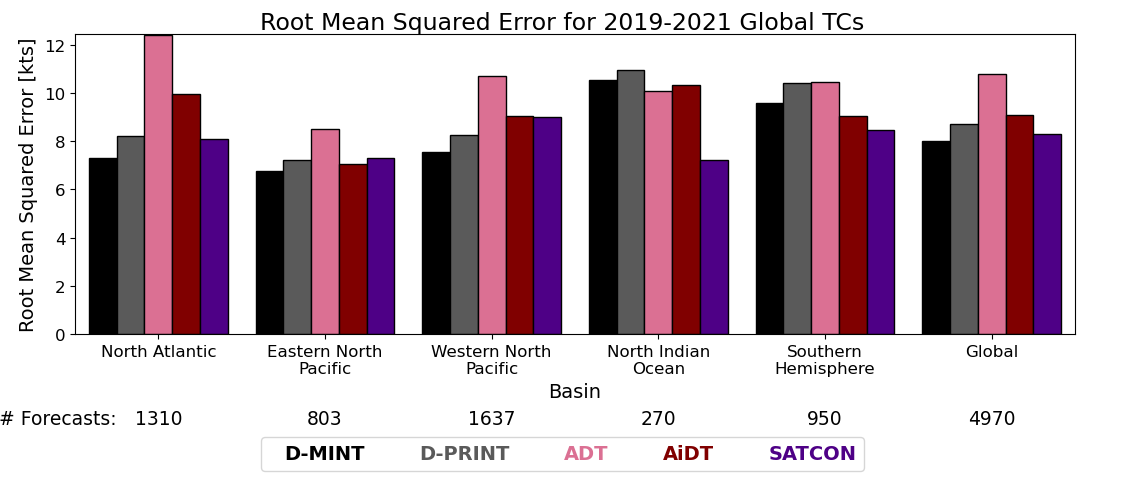
Paper Accepted on estimating current Tropical Cyclone Intensity: Sarah Griffin, Anthony Wimmers, and Chris Velden of the Cooperative Institute for Meteorological Satellite Studies recently had a paper accepted to Weather and Forecasting. This paper (https://journals.ametsoc.org/view/journals/wefo/aop/WAF-D-23-0085.1/WAF-D-23-0085.1.xml) presents two methods for estimating the current intensity of tropical cyclones (TCs). The methods, coined D-MINT and D-PRINT, are deep-learning/artificial intelligence models. D-MINT and D-PRINT use infrared imagery and environmental scalar predictors, while D-MINT also employs microwave imagery. This paper not only presents the current TC intensity estimates from D-MINT and D-PRINT, but also compares these estimates to three established intensity estimation methods routinely used by operational forecasters: ADT, AiDT, and SATCON. D-MINT and D-PRINT are more skillful than these operational estimates for North Atlantic, and eastern and western North Pacific TCs (see Figure). Current TC intensity estimations from D-MINT and D-PRINT are available in real time on the CIMSS tropical cyclone webpage at https://tropic.ssec.wisc.edu/real-time/DMINT/ and https://tropic.ssec.wisc.edu/real-time/DPRINT/ and have been utilized by operational forecasters during the 2023 hurricane seasons, including being referenced over 20 times by forecasters at the National Hurricane Center. (S. Griffin, CIMSS, sarah.griffin@ssec.wisc.edu; T. Wimmers, CIMSS, wimmers@ssec.wisc.edu; C. Velden, CIMSS, chrisv@ssec.wisc.edu)
 (Click image to enlarge)
Figure: Figure. Root Mean Squared Error (RMSE) for estimating 2019-2021 TCs current intensity by basin. A lower RMSE is more skillful.
OTHER:
| Archived Weeklies Page | Submit a report item |