| Data Details | FTP Site | Validation Info | Problems |
This data set consists of AVHRR retrievals of surface and cloud properties as well as radiative fluxes during the SHEBA (Surface HEat Budget of the Arctic Ocean) experiment. The data set covers the western Arctic, twice daily at a 5 km pixel size for all of 1997 to 1998. A 25 km data set covering the entire Arctic is also available.
SHEBA is a multiagency experiment that took place from the fall of 1997 through the fall of 1998. During that period a Canadian icebreaker frozen into an ice floe was used as a base for scientific studies of the ocean, ice, and atmosphere. Research aircraft from the U.S. (NCAR C-130, NASA ER-2, and UW Convair) and Canada (Candian Convair) also took part in the experiment during the spring and summer of 1998.Cloud and surface properties were estimated from AVHRR data for the SHEBA year. Five kilometer data from the AVHRR Polar Pathfinder project were used in the analyses. All images are centered on 14:00 (high sun) and 04:00 (low sun) local solar times, though the pixels within any given image may have been acquired 1-3 hours before or after those times. The area covered by the AVHRR images is shown in Figure 1. The retrieval algorithms of the Cloud and Surface Parameter Retrieval (CASPR) system were applied. The following parameters are available:
| Surface and Clouds: | Radiation: |
|---|---|
|
|
Figure 1. The area covered by the AVHRR data (box). The curve is the drift track of SHEBA ship during the year-long experiment. It started at 75.70oN, 144.10oW on Oct. 2, 1997 and ended at 78.20oN, 160.70oW on August 3,1998.
Retrieval results are available as daily images, monthly mean
images,
and daily and monthly mean values for the area as shown in Figure 1.
Examples of the image data are shown in Figure 2. These images give
monthly mean values based on the once-per-day AVHRR retrievals on 14:00
local solar time.
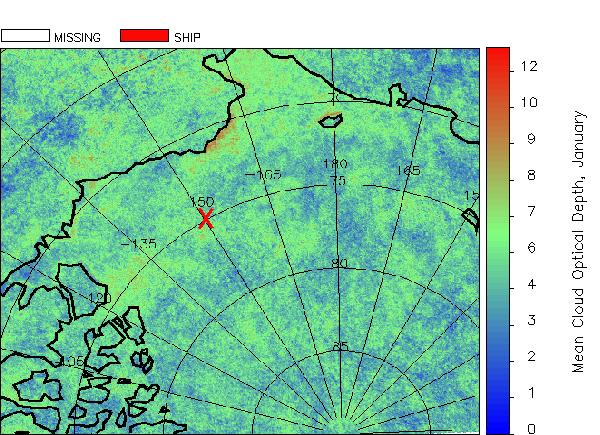
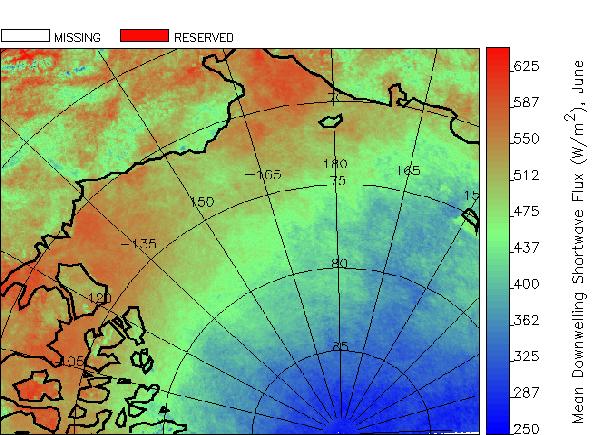
Figure 2. Top: Mean cloud optical thickness in January. Bottom: Mean downwelling shortwave flux at the surface in June. "X" marks the approximate location of the SHEBA ship.
An application of the ship-area mean results is shown in Figure 3, which is based on daily mean surface temperatures for a 25 x 25 km area around the ship at 14:00 local solar time.

Figure 3. Time series of all-sky surface skin temperature from the AVHRR and that measured at the SHEBA ship at 14:00 local solar time.