[ Archive ]
| CIMSS-NOAA Weekly Report [ Archive ] |
CIMSS-NOAA WEEKLY HIGHLIGHTS FOR THE WEEK ENDING MAY 31, 2024
DATA, INFORMATION, AND USE-INSPIRED SCIENCE:
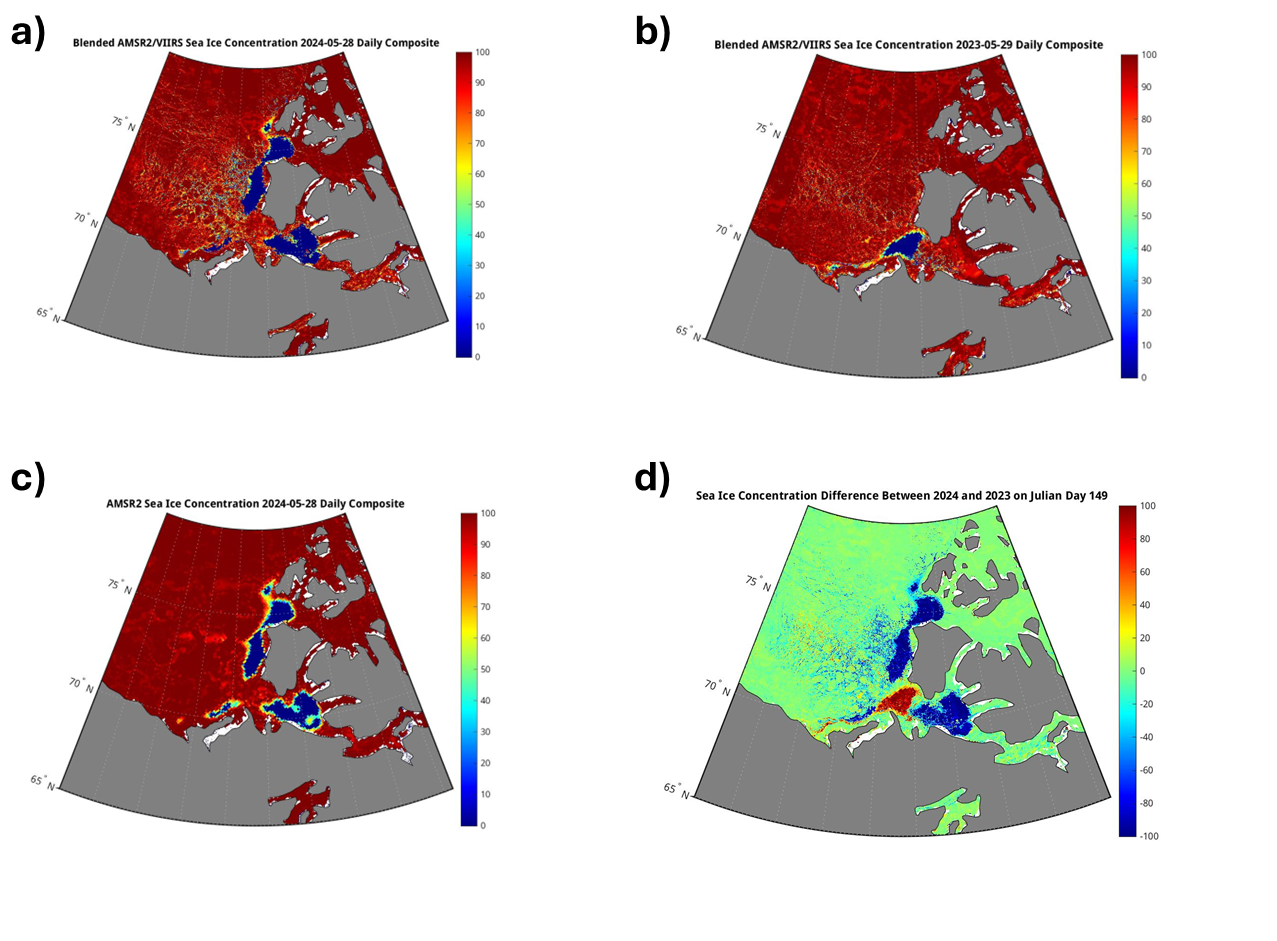
Blended Sea Ice Concentration Product Observes Early Breakup of Sea Ice in the Eastern Beaufort Sea: The Blended AMSR2/VIIRS Sea Ice Concentration product observed the early breakup of the sea ice in the eastern Beaufort Sea. The significance of this event is that this area is usually covered by thick pack ice in late May, and that area usually does not see breakup of the ice until August at the earliest, if it does at all. In recent years (2016 onwards) openings off the west coast of Banks Island are not uncommon; however, the width and northern extent near Melville Islands so early makes this most unusual. Also of note is the early openings in the sea ice field over the far western northern route of the Northwest passage and southern route of the Northwest passage southeast/southwest of Banks/Victoria Islands. (R. Dworak, CIMSS, 608-265-8620)
 (Click image to enlarge)
Figure: a) AMSR2/VIIRS Blended Sea Ice Concentration from 28 May 2024. b) AMSR2 only Sea Ice Concentration from same day. c) AMSR2/VIIRS Blended Sea Ice Concentration from same julian day in 2023 d) Difference (2024-2023 julian day 149) in Sea Ice Concentration from previous year.
FUTURE OUTLOOK:
AWARDS AND RECOGNITION:
TRAVEL AND MEETINGS:
TRAINING AND EDUCATION:
VISIT Training on GOES-R IFR Probability: Scott Lindstrom from the Cooperative Institute for Meteorological Satellite Studies (CIMSS) gave a Virtual Institute for Satellite Integration Training (VISIT) session for a National Weather Service forecaster from the forecast office in Tampa FL. The topic was GOES-R Fog/Low Stratus Detection using Instrument Flight Rules (IFR) Probability Fields and Cloud Thickness products. The instruction was followed by a brief question and answer session. (S. Lindstrom, CIMSS, 608 263 4425)
MEDIA INTERACTIONS AND REQUESTS:
SOCIAL MEDIA AND BLOG Posts:
SSEC and CIMSS Scientists in the news: Scientists at the University of Wisconsin-Madison (UW) Space Science and Engineering Center (SSEC) and the Cooperative Institute for Meteorological Satellite Studies (CIMSS) provide expert interviews, imagery and case studies to promote science and satellite imagery. This week: 1) CIMSS Satellite Blog contributors Scott Bachmeier and Scott Lindstrom published the following case studies: "Hail swath across the Texas Panhandle" (May 29); "Wildfire in British Columbia produces 2 pyrocumulonimbus clouds" (May 29); "Severe thunderstorms across the southern and central Plains" (May 25); "PHS model output during Day 4 of Week 2 at HWT" (May 24). Read more at the CIMSS Satellite Blog. (S. Lindstrom, CIMSS, 608-263-4425; S. Bachmeier, CIMSS; E. Verbeten, SSEC, 608-263-4206)
 (Click image to enlarge)
Figure: GOES-18 Day Land Cloud Fire RGB (top left), Shortwave Infrared (3.9 µm, top right), “Clean” Infrared Window (10.3 µm, bottom left) and “Red” Visible (0.64 µm) images with an overlay of the Fire Mask derived product (bottom right), from 1900 UTC on 29 May to 0200 UTC on 30 May.
PUBLICATIONS:
OTHER:
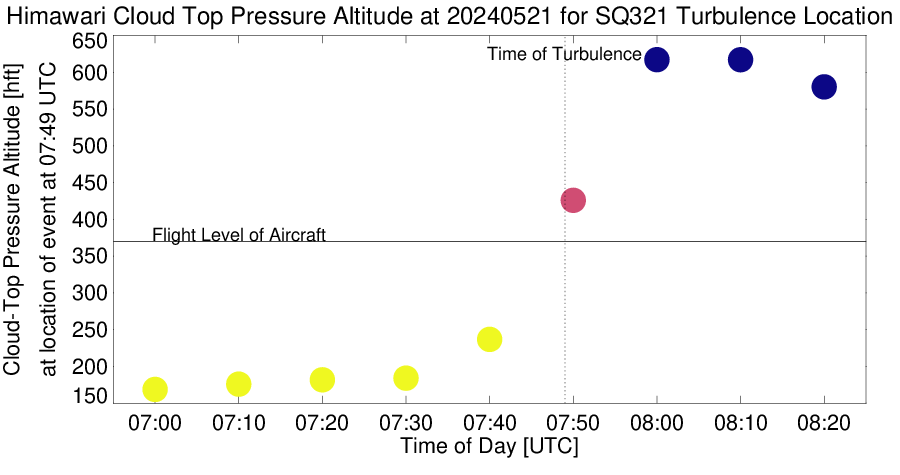
CIMSS scientists contacted by NTSB for assistance: Investigators at the National Transportation Safety Board (NTSB) contacted researchers at The Cooperative Institute for Meteorological Satellite Studies (CIMSS) at the University of Wisconsin (UW)-Madison for assistance with satellite imagery associated with the Singapore Airlines turbulence event. This turbulence injured 104 people and resulted in one fatality. CIMSS Researchers directed the NTSB to the CIMSS Satellite Blog, which includes Himawari brightness temperatures and cloud-top heights, as well as the probability of moderate or greater (MOG) turbulence product. After receiving confirmation of the latitude and longitude of the turbulence event, CIMSS researchers created a time series of cloud-top height, cloud-top pressure, and pressure altitude at the location of the turbulence event. These time series depict a rapidly growing convective cloud. (S. Bachmeier, CIMSS, scott.bachmeier@ssec.wisc.edu, S. Lindstrom, CIMSS, scottl@ssec.wisc.edu, S. Griffin, CIMSS, sarah.griffin@ssec.wisc.edu, & A. Wimmers, CIMSS, wimmers@ssec.wisc.edu).
 (Click image to enlarge)
Figure: Time Series of Cloud-Top Pressure Altitude at the location of the Singapore Airlines turbulence location. The flight level of the aircraft is indicated by the horizontal black line, and the vertical dotted line indicates the time turbulence was observed.
| Archived Weeklies Page | Submit a report item |