[ Archive ]
| CIMSS-NOAA Weekly Report [ Archive ] |
CIMSS-NOAA WEEKLY HIGHLIGHTS FOR THE WEEK ENDING MARCH 28, 2025
DATA, INFORMATION, AND USE-INSPIRED SCIENCE:
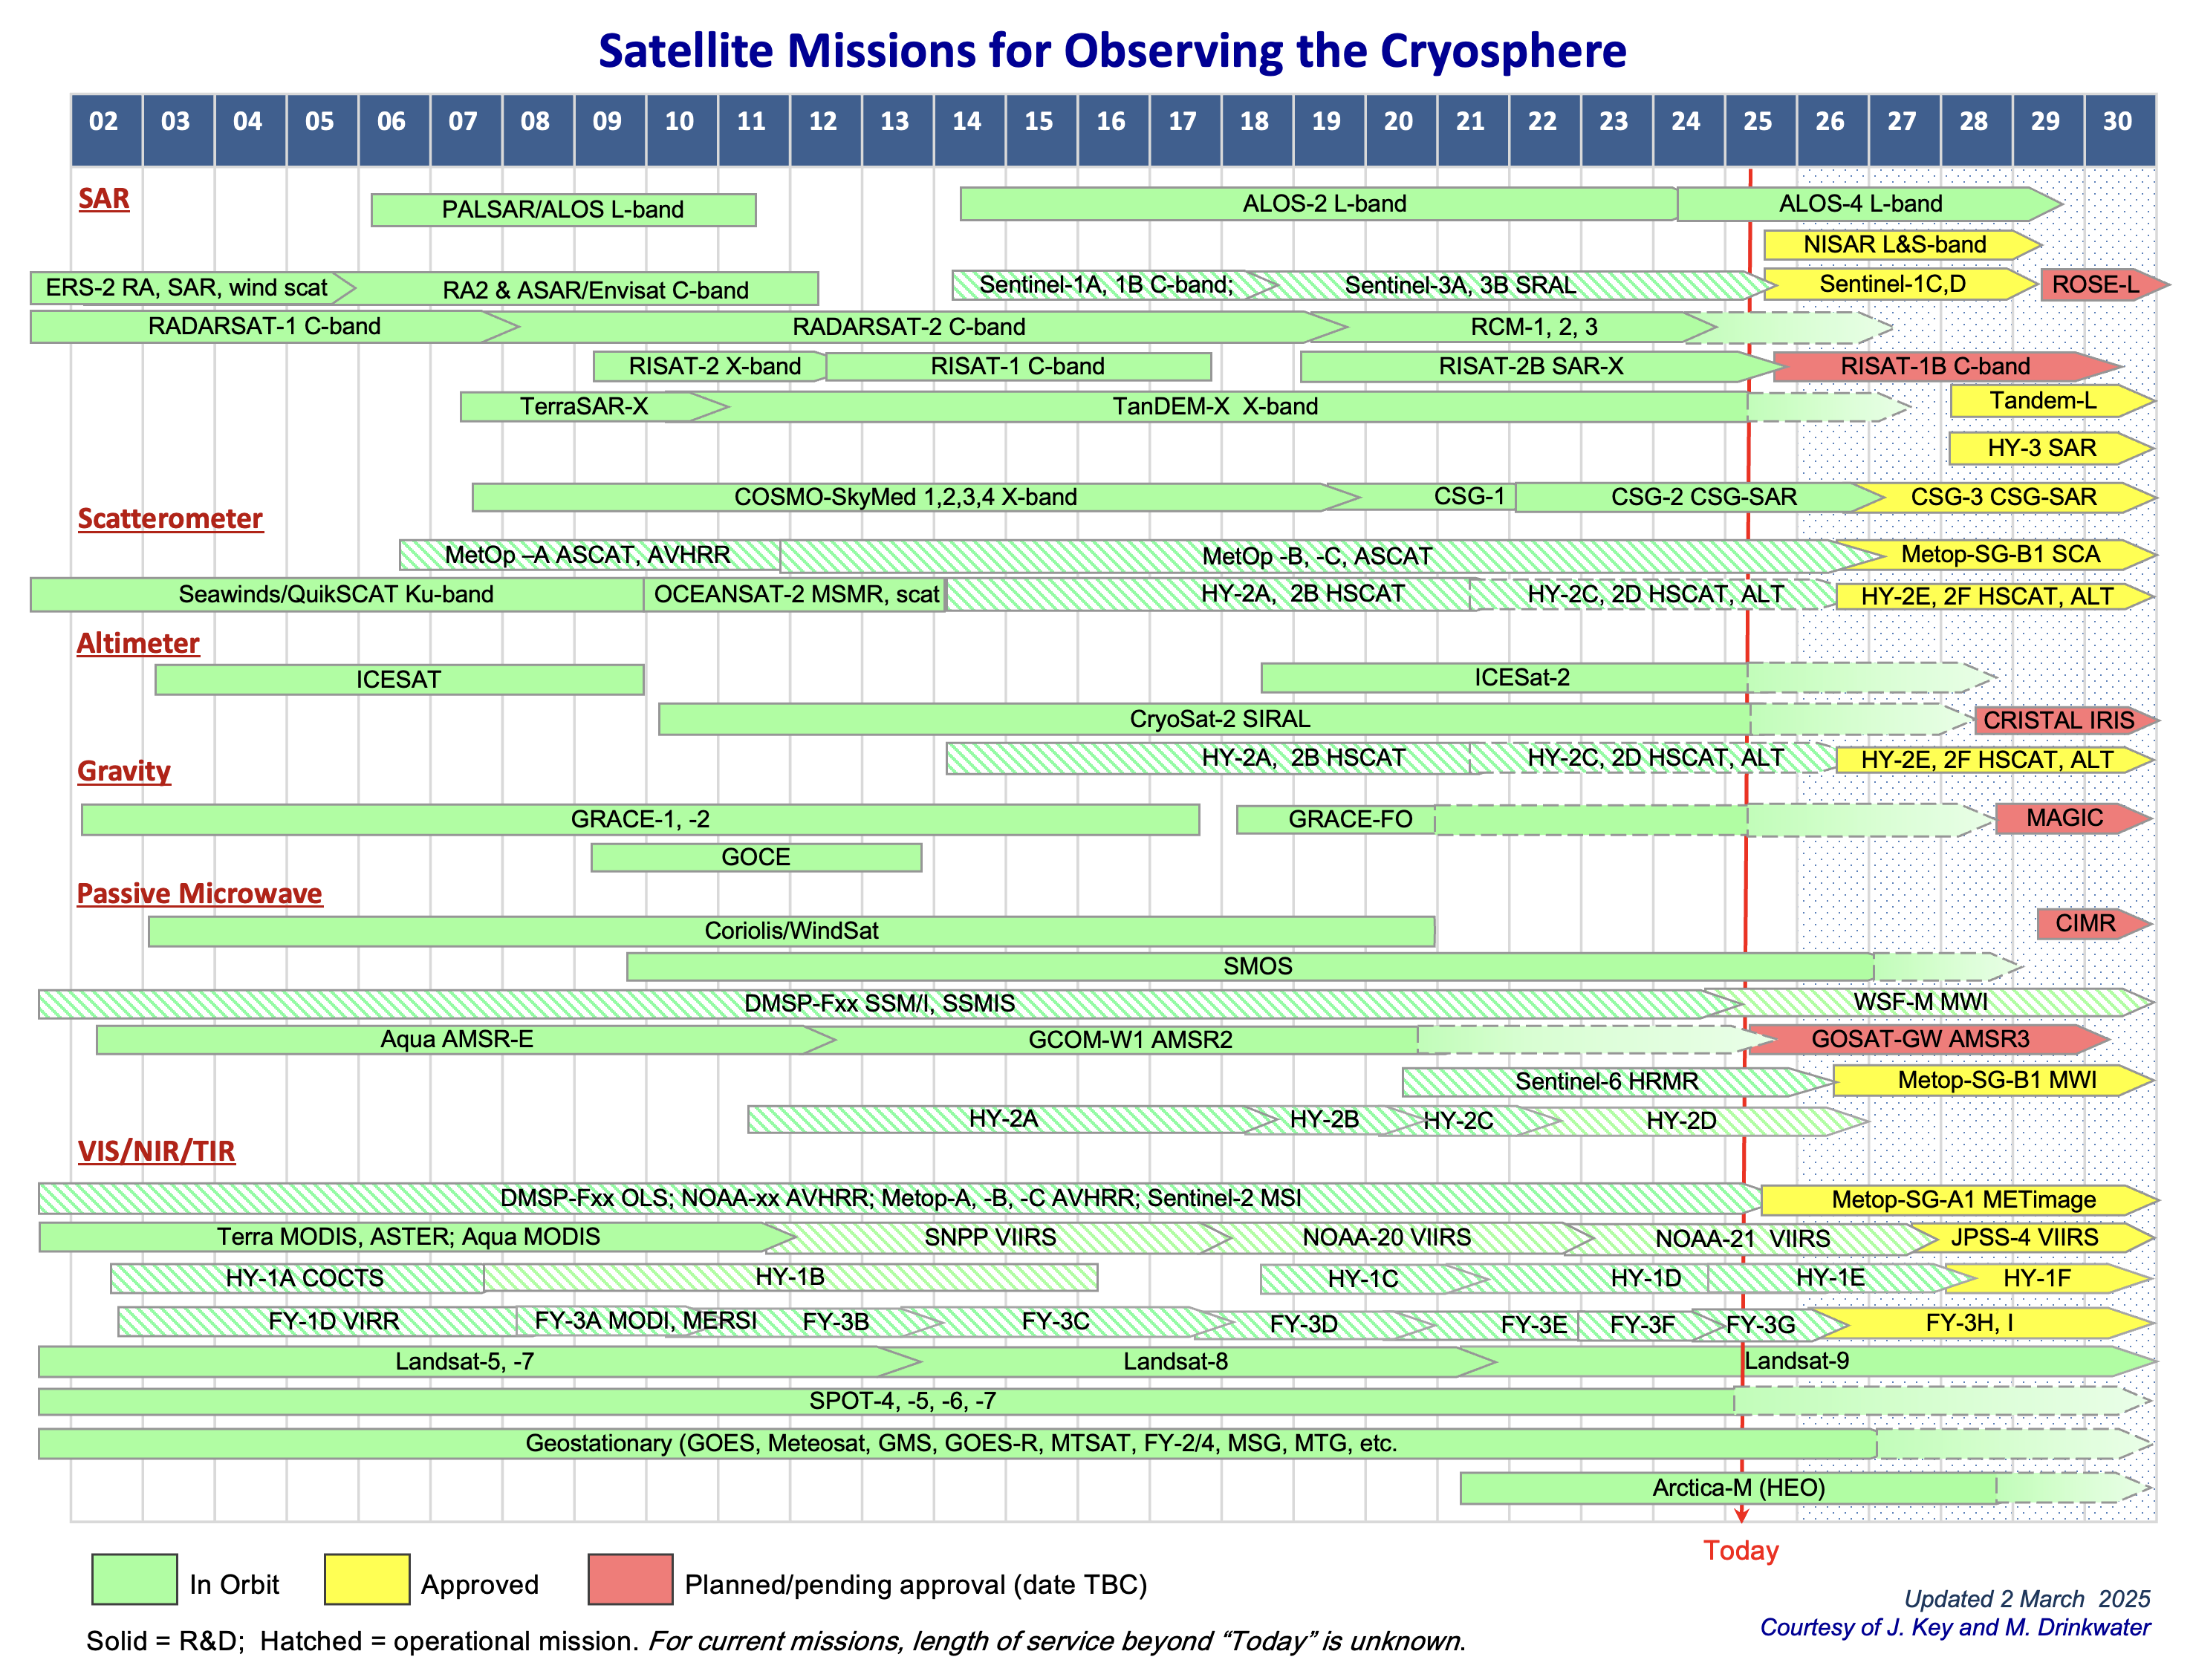
Graphical timeline of satellite missions supporting observations of the cryosphere: A graphical timeline showing satellite missions that support observations of the cryosphere (snow, sea ice, freshwater ice, glaciers, ice sheets, and permafrost) has been updated through March 2025. The graphic was originally produced many years ago by Mark Drinkwater of the European Space Agency, in part as a task of the World Meteorological Organization (WMO) Polar Space Task Group (PSTG) and also in support of the WMO Global Cryosphere Watch (GCW). Jeff Key (Cooperative Institute for Meteorological Satellite Studies, CIMSS, formerly NOAA) updates the timeline every 2-3 years. Please report any errors and omissions to him. (J. Key, CIMSS, 608-890-4239)
 (Click image to enlarge)
Figure: Past, current, and planned satellite missions that support observations of snow, floating ice, land ice, and (indirectly) permafrost.
FUTURE OUTLOOK:
AWARDS AND RECOGNITION:
TRAVEL AND MEETINGS:
TRAINING AND EDUCATION:
CIMSS Convective Machine-Learning Tools described at Australian Virtual Lab Center of Excellent Regional Focus Group Meeting: Scott Lindstrom from the Cooperative Institute for Meteorological Satellite Studies (CIMSS) gave a distance presentation at the Australian Bureau of Meteorology's Virtual Laboratory (VLab) Center Of Excellence Regional Focus Group Meeting on 25 March 2025. The topic was AI Methods for Predicting Convective Hazards Weather and detailed the work of CIMSS' John Cintineo (NOAA/OAR) and others. Three different products were discussed: ProbSevere Version 3, Intense StormNet, and LightningCast. CSPP Geo software that produces LightningCast imagery was also discussed. The 25-minute talk was attended by 45 people from around the western Pacific/Oceania and was followed by questions and answers. A recording of this session is available here. (S. Lindstrom, CIMSS, 608 263 4425; J. Cintineo, NOAA/OAR)
MEDIA INTERACTIONS AND REQUESTS:
SOCIAL MEDIA AND BLOG Posts:
CIMSS Satellite Blog Updates: The Cooperative Institute for Meteorological Satellite Studies (CIMSS) Satellite Blog was updated with the following posts: "von Kármán vortex street in the Bering Sea" (Mar. 20), "The impact of satellite inputs in ProbSevere v3" (Mar. 21), "You can use GOES-R Soundings to mitigate the loss of conventional radiosondes" (Mar. 24), "1-minute GOES-18 images to monitor heavy rainfall potential across American Samoa" (Mar. 24) and "Fast-moving wildfires produce pyrocumulonimbus clouds over South Korea" (Mar. 25). (S. Bachmeier, S. Lindstrom, CIMSS, 608.263.4425, J. Cintineo, NOAA/OAR)
 (Click image to enlarge)
Figure: JMA Himawari-9 “Red” Visible (0.64 µm, top), Shortwave Infrared (3.9 µm, center) and “Clean” Infrared Window (10.4 µm, bottom) images at 0855 UTC on 25 March 2025, showing a pyrocumulonimbus cloud that developed along the eastern edge of a wildfire complex near the coast of South Korea.
PUBLICATIONS:
Review Article on Satellite Applications to Tropical Cyclones Published: An invited article was published in the Journal of the European Meteorological Society. The paper, titled "Recent Innovations in Satellite-Based Applications and their Impacts on Tropical Cyclone Analyses and Forecasts" by C. Velden, J. Knaff, D. Herndon, J. Hawkins et al., is a review article that chronicles recent satellite-based products and innovations toward improving the analysis of global tropical cyclones. 'Medicanes' are also briefly highlighted, as these storms which occur over the Mediterranean Sea can have many characteristics of tropical cyclones and result in highly impactful European weather events. The article presents an overview of some of the recent advances in meteorological satellite capabilities (LEO and GEO) to observe tropical cyclones and Medicanes, along with emerging techniques to analyze the data into TC-focused diagnostic products. Contributions by NOAA/NESDIS and cooperative research institutes CIMSS and CIRA figure prominently. Citation: Velden, C., J. Knaff, D. Herndon, A. Mouche, J. Hawkins, G. Panegrossi, A. Stoffelen, J. Courtney, T. Tsukada, and A. Fontan, 2025: Recent innovations in satellite-based applications and their impacts on tropical cyclone analyses and forecasts. J. Eur. Met. Soc., Vol. 2, 100011, ISSN 2950-6301, https://doi.org/10.1016/j.jemets.2025.100011. (C. Velden, CIMSS; J. Knaff, NOAA/STAR/CIRA; D. Herndon and J. Hawkins, CIMSS)
 (Click image to enlarge)
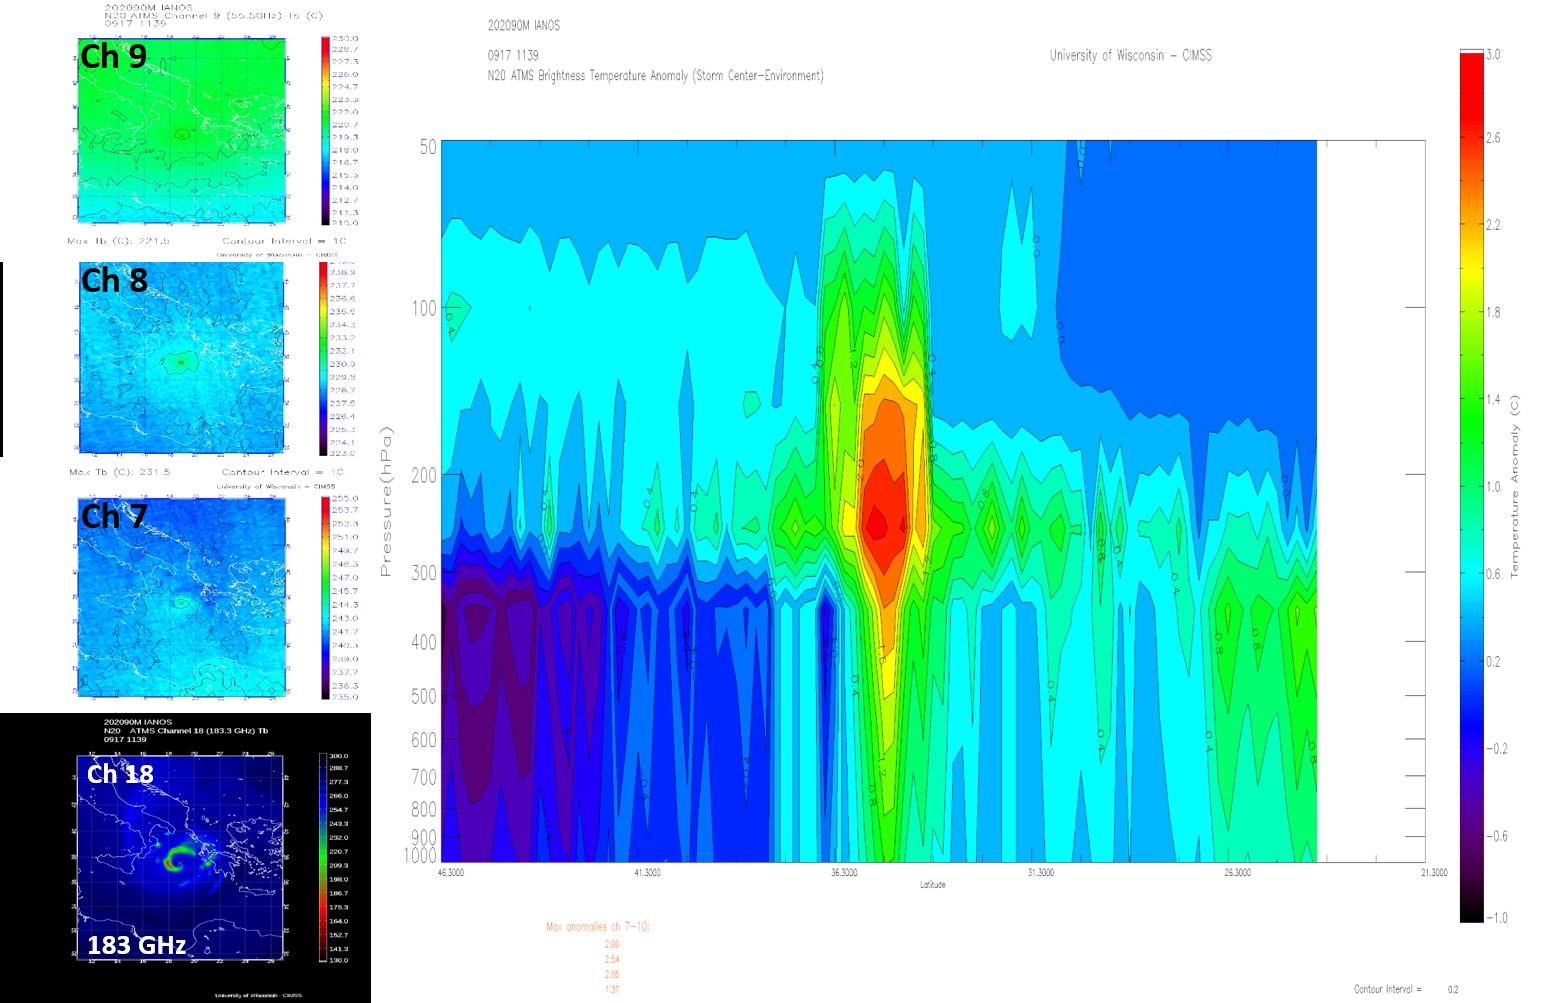
Figure: View of Medicane Ianos from a NOAA-20 ATMS overpass at 11:39 UTC 17 Sept. 2020. Planar Tb views from the sounder thermal channels 7-9 are shown on the left. A longitudinal cross-section of Tb anomaly (deg. C) through the center of Ianos shows the warm-core structure similar to tropical cyclones. The 183 GHz (channel 18) shows a ring of deep convection around the center of Ianos similar to an eyewall. [Credit: CIMSS]
 (Click image to enlarge)
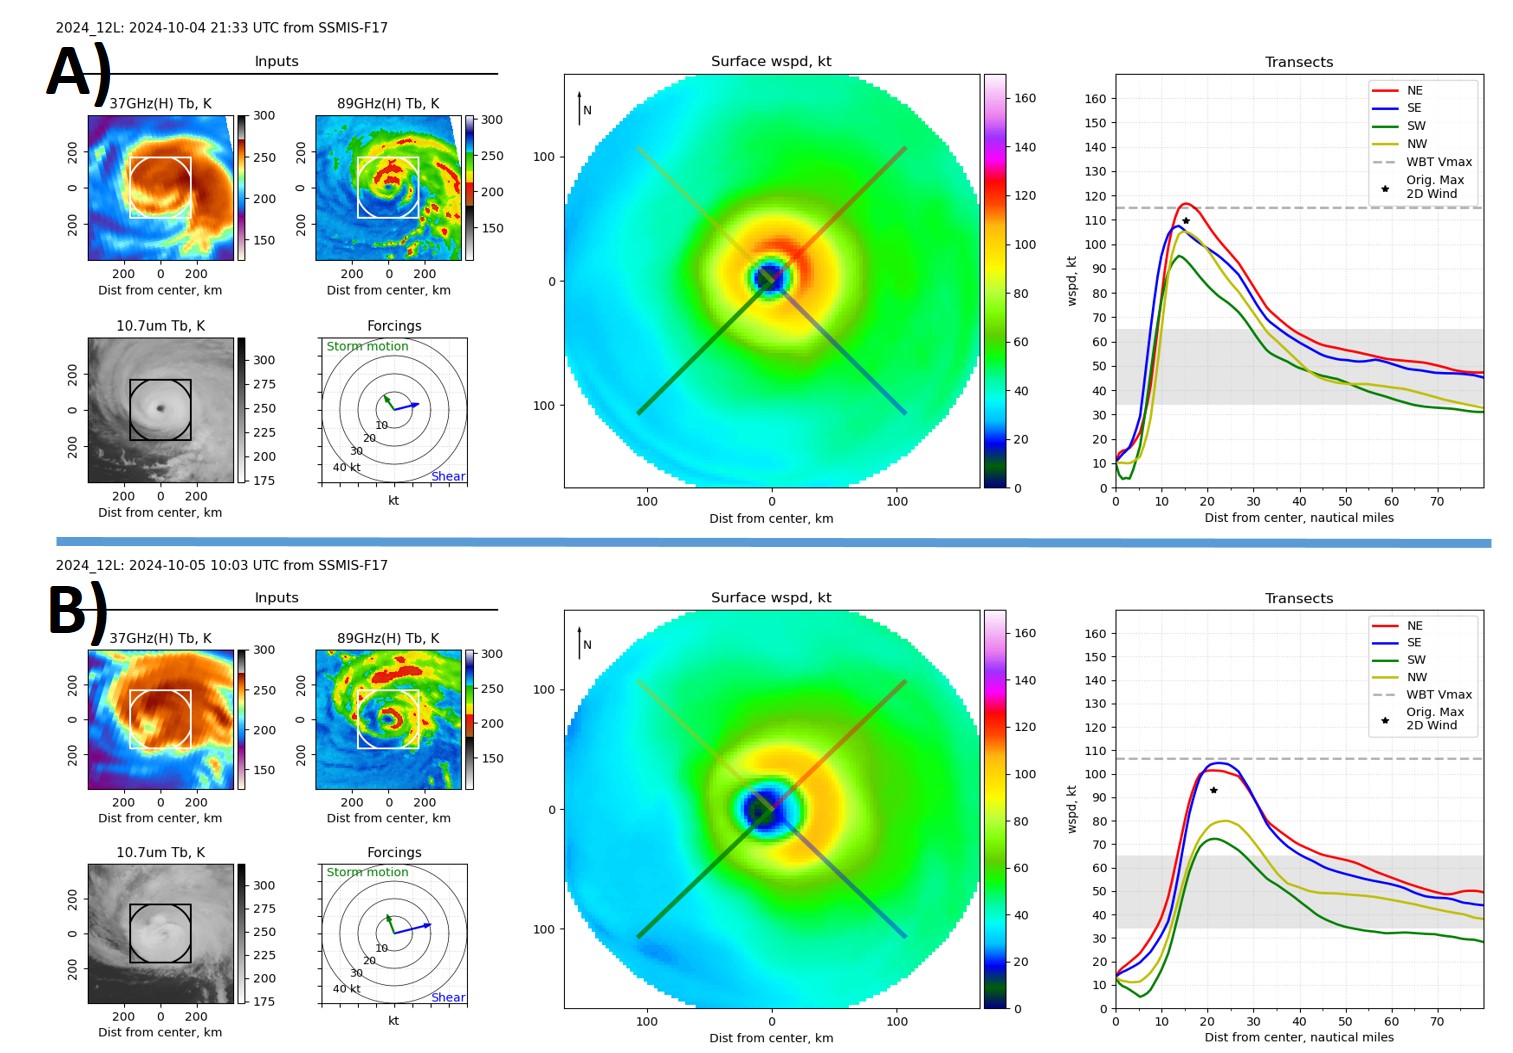
Figure: Hurricane Kirk inner-core surface wind fields produced from the deep learning method of Wimmers et al., 2024; https://doi.org/10.1175/AIES-D-23-0084.1, for A) 2133 UTC on 4 Oct., and B) 1003 UTC on 5 Oct. 2024. Input data (left panels) consists of SSMIS 37 and 89 GHz Tb, and 10.7 μm Tb from GOES-16, along with estimates of storm motion and environmental shear. The middle panels show the color-coded (by wind speed, in kts) 2-D surface wind field. The right-hand panels depict the horizontal radial wind profiles along the 4 quadrant transects depicted in the middle panels, along with the model and NHC working best track (WBT) maximum surface wind estimates. [Credit: A. Wimmers, CIMSS]
OTHER:
| Archived Weeklies Page | Submit a report item |