[ Archive ]
| CIMSS-NOAA Weekly Report [ Archive ] |
CIMSS-NOAA WEEKLY HIGHLIGHTS FOR THE WEEK ENDING MAY 10, 2025
DATA, INFORMATION, AND USE-INSPIRED SCIENCE:
Recent Enhancements to VIIRS Functionality in McIDAS-V: Through a collaboration between researchers at the Cooperative Institute for Meteorological Satellite Studies (CIMSS) and the Cooperative Institute for Research in the Atmosphere (CIRA) VIIRS Imagery Team, two features were added to the Man computer Interactive Data Access System (McIDAS-V) visualization software. The first adds the ability to convolve hyperspectral IR channels into simulated imager bands. For example, unlike the Moderate Resolution Imaging Spectroradiometer (MODIS) instrument on Terra and Aqua, the Visible Infrared Imaging Radiometer Suite (VIIRS) does not have a water vapor or CO2 band. By combining many CrIS channels, using a weighted average, simulated VIIRS H2O and CO2 bands can be generated. This functionality, integrated from the HYperspectral-viewer for Development of Research Applications (HYDRA2) software developed at the Space Science and Engineering Center (SSEC), is currently available in the McIDAS-V nightly build. For example, NOAA-21 CrIS data convolved between wavenumbers 1400.625 and 1487.5 cm-1 will result in a simulated Advanced Himawari Imager (AHI) band 9 mid-level water vapor image. The second feature added to McIDAS-V is the ability to interactively create Rayleigh-corrected RGB images from VIIRS visible bands. A VIIRS true color RGB image is generated using bands M5 (Red, 0.672 µm), M4 (Green, 0.555 µm), and M3 (Blue, 0.488 µm), with each band subjected to Rayleigh correction to remove molecular scattering effects and enhance surface feature visibility (D. Santek, CIMSS, 608-263-7410; T. Jasmin, CIMSS; R. Carp, CIMSS)
 (Click image to enlarge)
Figure: Visualization in McIDAS-V of: Himawari AHI band 9 (6.9 µm water vapor band) brightness temperature (left); Convolved CrIS channels simulating AHI band 9 (right).
 (Click image to enlarge)
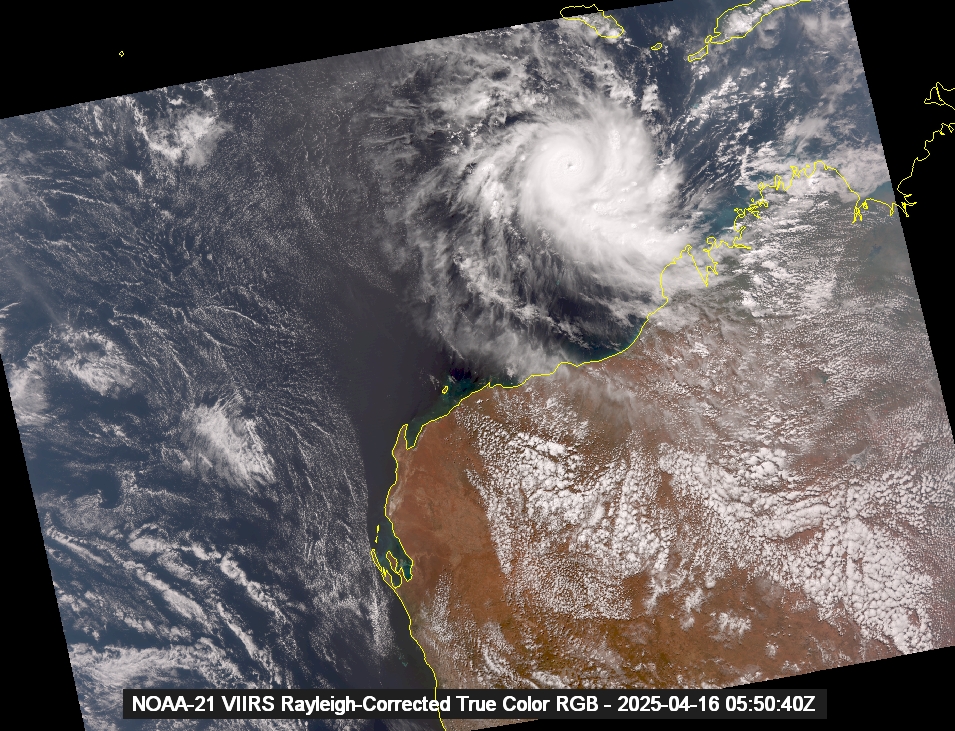
Figure: Rayleigh-corrected true color RGB from NOAA-21 VIIRS SDR data on 16 April 2025 at 0550 UTC near northwest Australia. This scene is over Tropical Cyclone Errol, which intensified on this day to a category-5 equivalent hurricane with max sustained winds of 160 mph.
FUTURE OUTLOOK:
AWARDS AND RECOGNITION:
TRAVEL AND MEETINGS:
TRAINING AND EDUCATION:
MEDIA INTERACTIONS AND REQUESTS:
SOCIAL MEDIA AND BLOG Posts:
CIMSS Satellite Blog Updates: The Cooperative Institute for Meteorological Satellite Studies (CIMSS) Satellite Blog was updated with the following posts: "Atmospheric spectra over the west Pacific" (May 2), "Episode 19 of the latest Kilauea eruption on the Big Island of Hawai’i" (May 2), "26-year anniversary of the May 3, 1999 tornado outbreak in Oklahoma" (May 3), "Cut off over the Ohio River Valley" (May 5), "Dust plume on the coast of China as viewed by a sounder" (May 6), "Episode 20 of the latest Kilauea eruption on the Big Island of Hawai’i" (May 7), "Persistent convection over Tutuila, American Samoa late on 30 April Samoa Standard Time" (May 7) and "1-minute GOES-18 imagery to monitor convection across American Samoa" (May 8). (S. Bachmeier, S. Lindstrom, 608.263.4425, CIMSS)
 (Click image to enlarge)
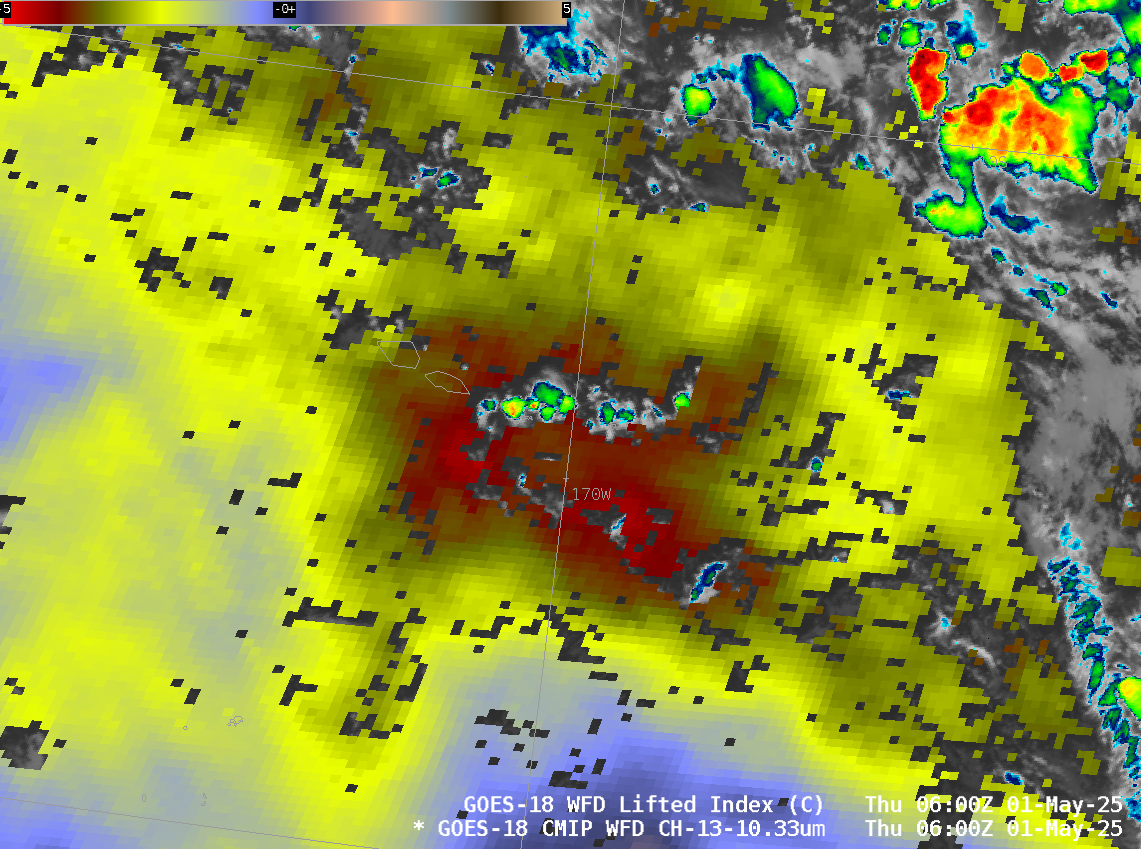
Figure: GOES-18 Derived Lifted Index (in clear air) and Clean Window infrared (Band 13, 10.3) imagery, showing deep convection over American Samoa on 1 May 2025.
 (Click image to enlarge)
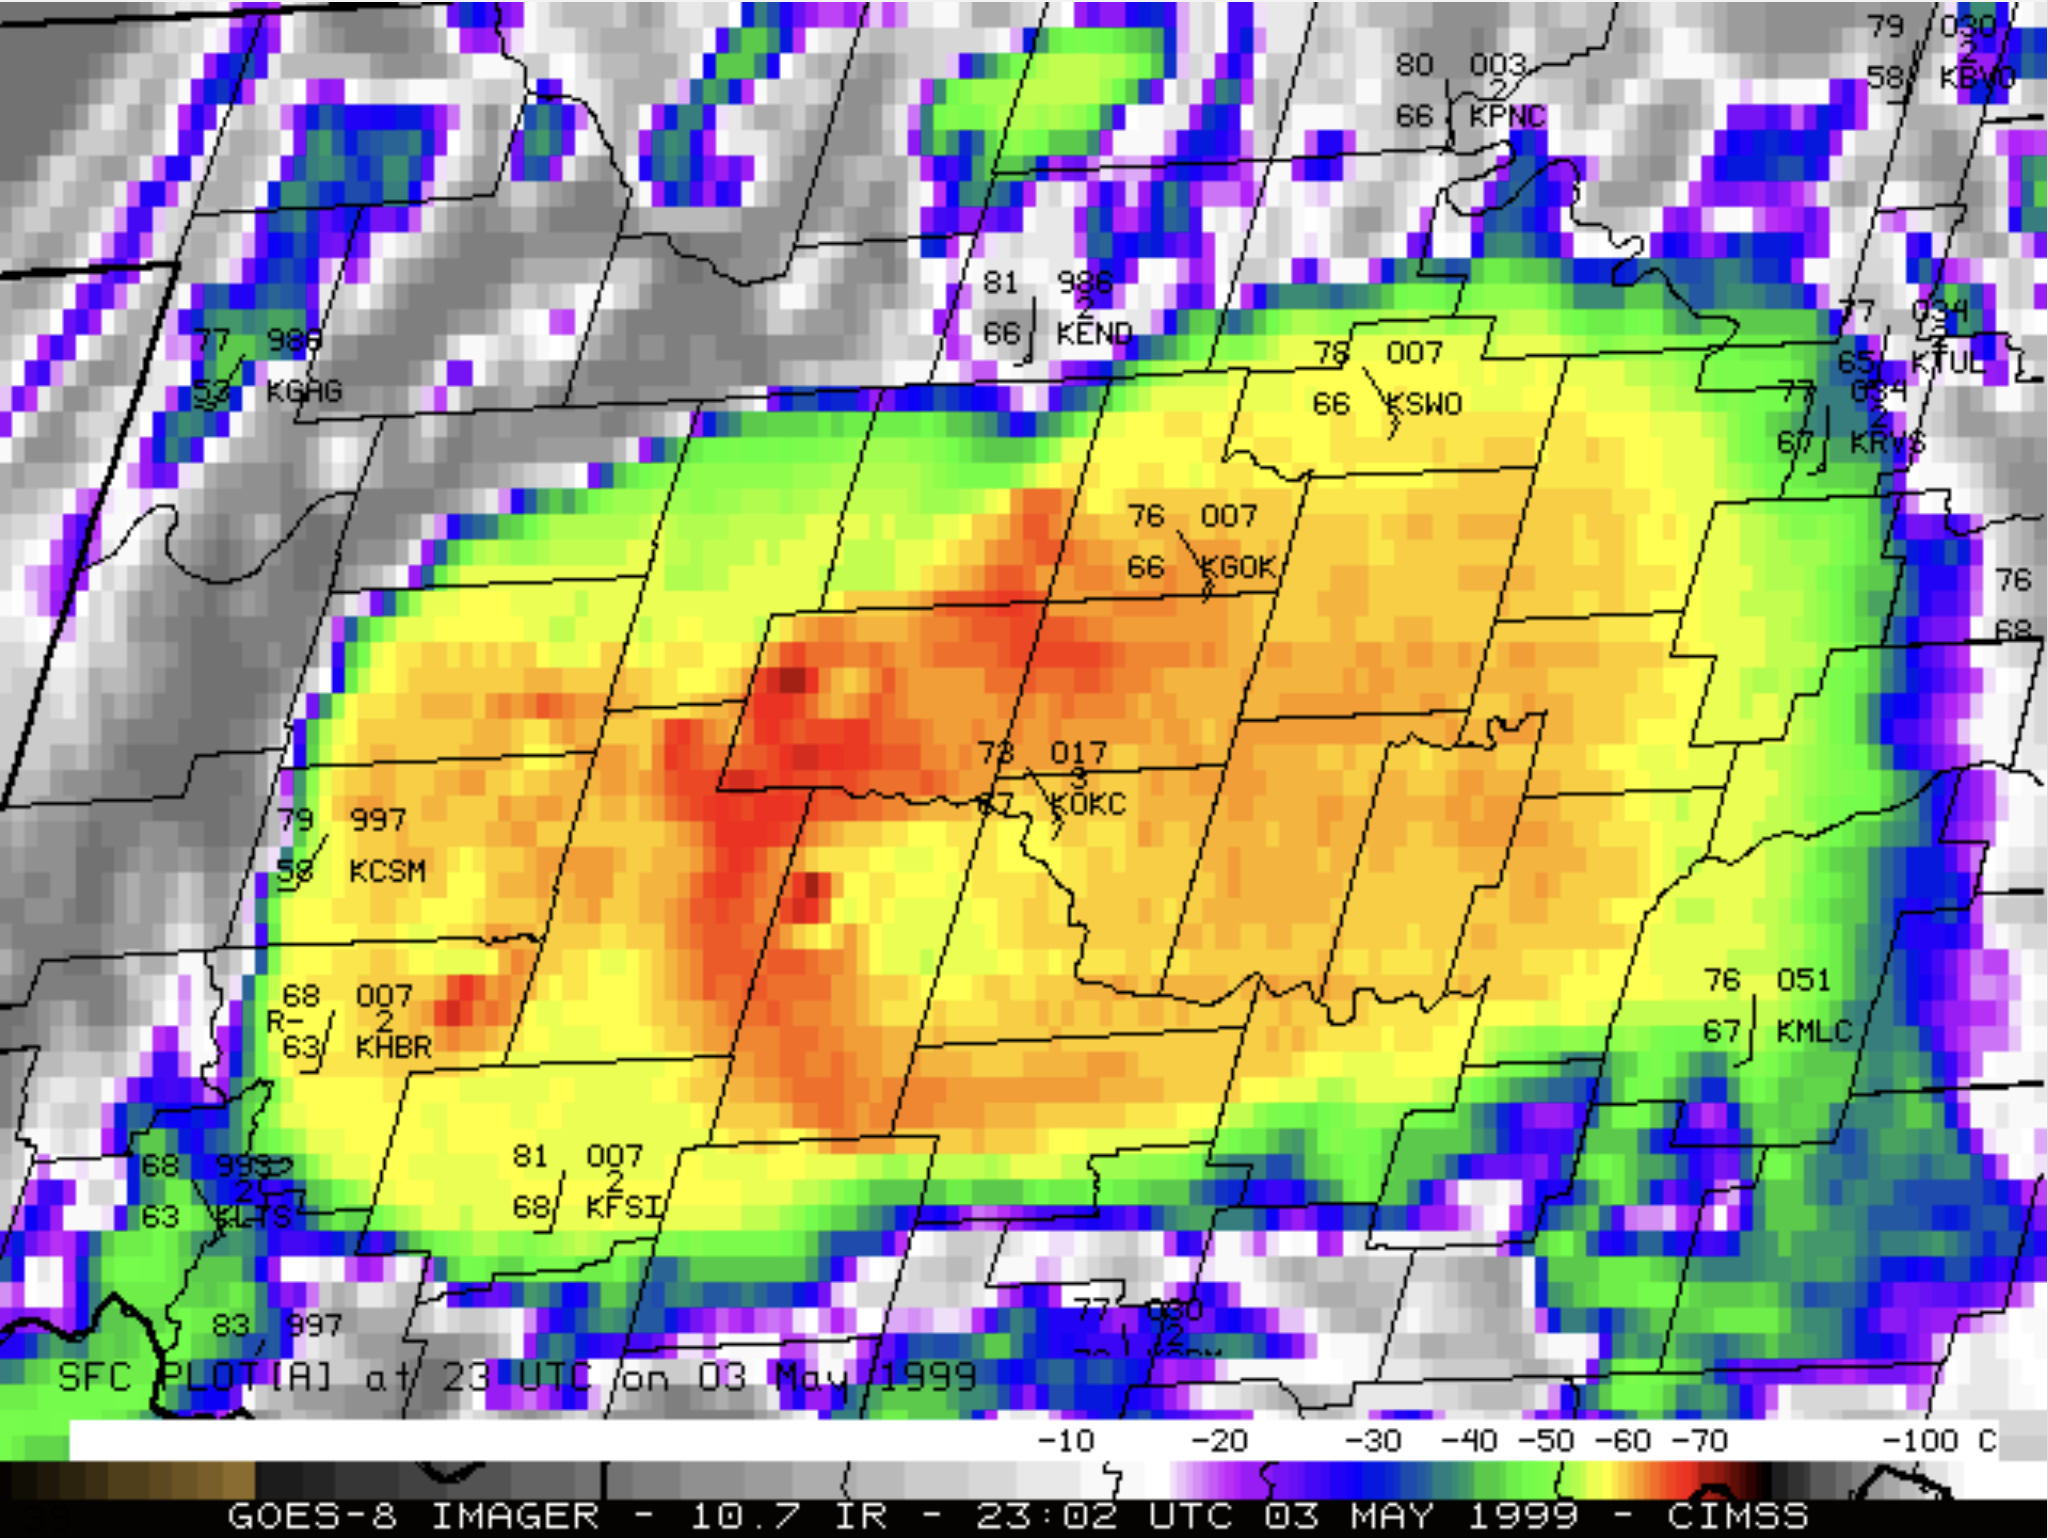
Figure: GOES-8 Infrared image at 2302 UTC on 03 May 1999, showing the supercell thunderstorm that went on to produce deadly F4/F5 tornadoes in the Oklahoma City area.
PUBLICATIONS:
OTHER:
| Archived Weeklies Page | Submit a report item |