[ Archive ]
| CIMSS-NOAA Weekly Report [ Archive ] |
CIMSS-NOAA WEEKLY HIGHLIGHTS FOR THE WEEK ENDING JUNE 20, 2025
DATA, INFORMATION, AND USE-INSPIRED SCIENCE:
CIMSS Reports MTG FCI Anomalies: Researchers at the Cooperative Institute for Meteorological Satellite Studies (CIMSS) noticed two anomalies associated with hot pixels in the shortwave window bands of the METEOSAT Third Generation (MTG) Flexible Combined Imager (FCI) and reported these findings to the GOES-R Calibration Working Group (CWG) and Algorithm Working Group (AWG). One of the recurring anomalies looks very similar to the "Cold Pixels Around Fires" (CPAF) anomaly on the GOES-R Series Advanced Baseline Imager (ABI) where the remapping algorithm would cause pixels near really hot fires (or other hotspots) to turn abnormally cold in the shortwave window band (which was corrected on ABI in 2019). The other anomaly, "Cold Wings", was also associated with hot pixels in that band where 2 pixels on the same line of data, approximately 20 pixels apart with the hot pixel between them, would be slightly colder than expected. ABI Scientist Dan Lindsey (NESDIS) reported these findings to EUMETSAT and learned that they are working on mitigation strategies for both. (M. Gunshor, CIMSS, matg@ssec.wisc.edu, C. Schmidt, CIMSS).
 (Click image to enlarge)
Figure: METEOSAT-12 FCI 1km Band 09 (3.8um) image on 25 May 2025 at 15:50 UTC showing fires (black pixels) in South Africa near the Mozambique border with anomalous cold pixels adjacent (white pixels).
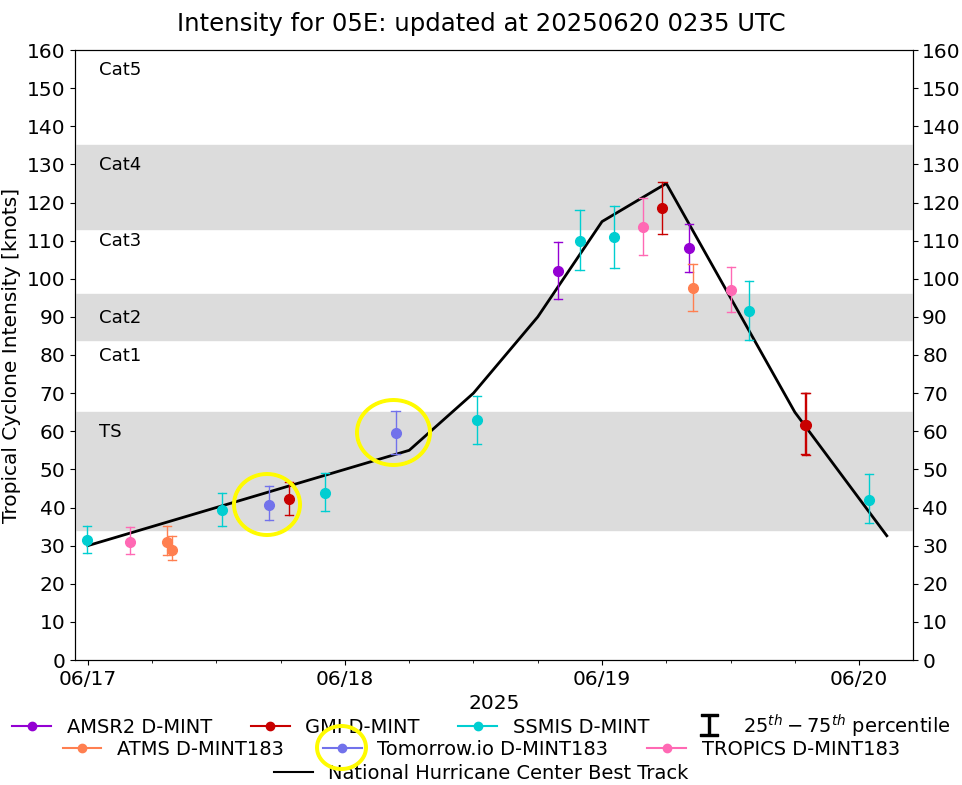
CIMSS produces tropical cyclone intensity guidance using Tomorrow.io satellite data: Cooperative Institute for Meteorological Satellite Studies (CIMSS) began producing the first tropical cyclone (TC) intensity estimates using data from commercial vendor Tomorrow.io for Hurricane Erick as the storm approached the coast of Mexico. The CIMSS Deep Multispectral INtensity of TCs estimator (D-MINT) is an automated AI-based algorithm that uses multispectral satellite data from geostationary and polar orbiting satellites to estimate storm intensity. Sarah Griffin from CIMSS quickly developed a version of the D-MINT algorithm to make use of the Tomorrow.io Microwave Sounder (TMS) 183 GHz channels. Cubesats such as the TMS can provide critical information on TC structure and intensity. NOAA concurrently worked with Tomorrow.io to set up a data pipeline to allow CIMSS access in near real time. In this case (see accompanying figure), a timely TMS pass filled a microwave data gap that spanned 14 hours between other polar orbiter satellite passes and occurred just as Hurricane Erick was about to undergo rapid intensification. CIMSS is working with NOAA to reduce data access latency and get the product in front of forecasters at both the National Hurricane Center and Joint Typhoon Warning Center within 1-2 hours of the TMS overpass of storms. This first demonstration represents a successful partnership between CIMSS, NOAA and Tomorrow.io to quickly develop and make available a useful L2 product using commercial satellite data access provided by NOAA in the just the last month. Plans are for continuing this demonstration through the 2025 hurricane season. (D. Herndon, CIMSS, 608-262-6741)
 (Click image to enlarge)
Figure: CIMSS D-MINT tropical cyclone intensity display for Hurricane Erick noting the two Tomorrow.io estimates highlighted with the yellow circles.
FUTURE OUTLOOK:
AWARDS AND RECOGNITION:
TRAVEL AND MEETINGS:
TRAINING AND EDUCATION:
MEDIA INTERACTIONS AND REQUESTS:
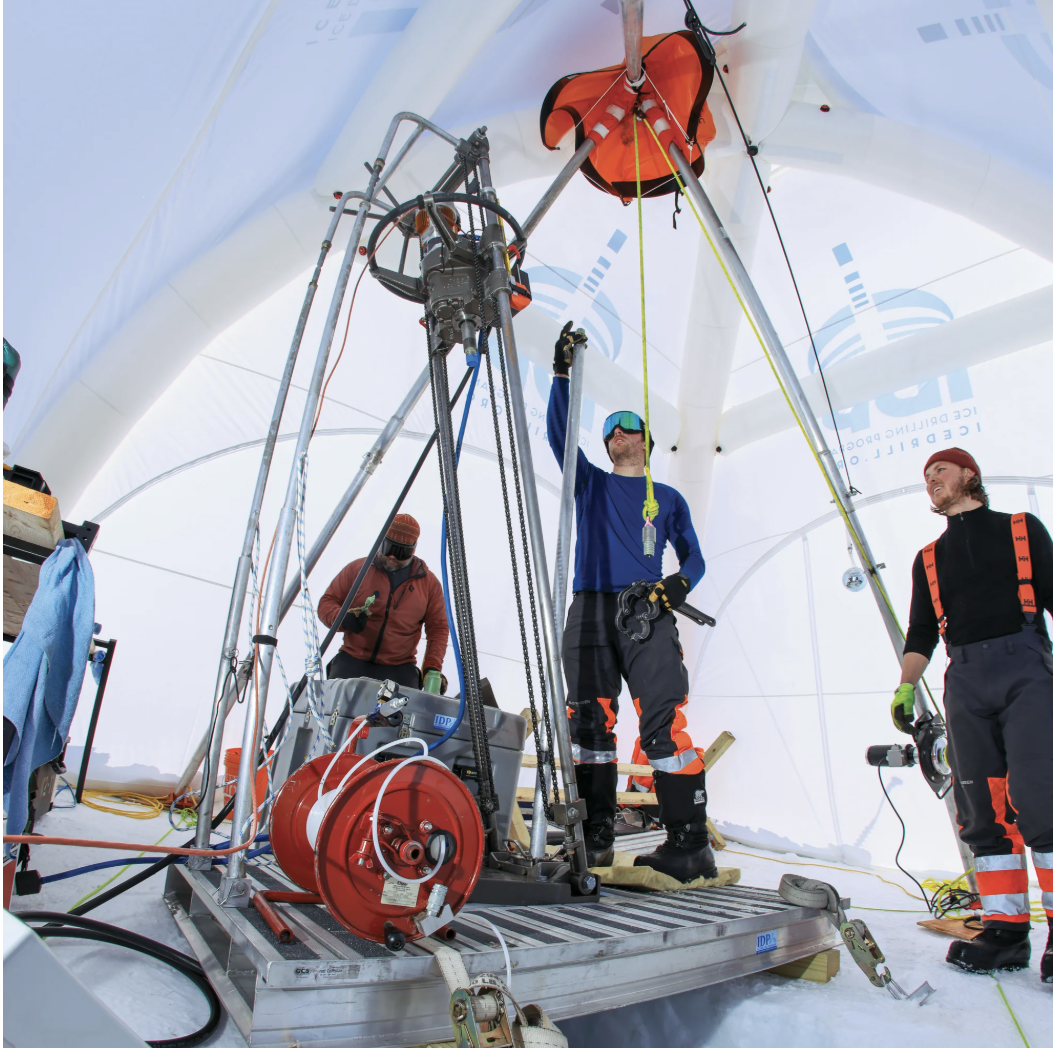
SSEC and CIMSS Scientists in the News: Scientific American published a story about the Greenland Ice Sheet and features SSEC Ice Drilling Program drillers and engineers. (E. Verbeten, SSEC, 608-263-4206)
 (Click image to enlarge)
SOCIAL MEDIA AND BLOG Posts:
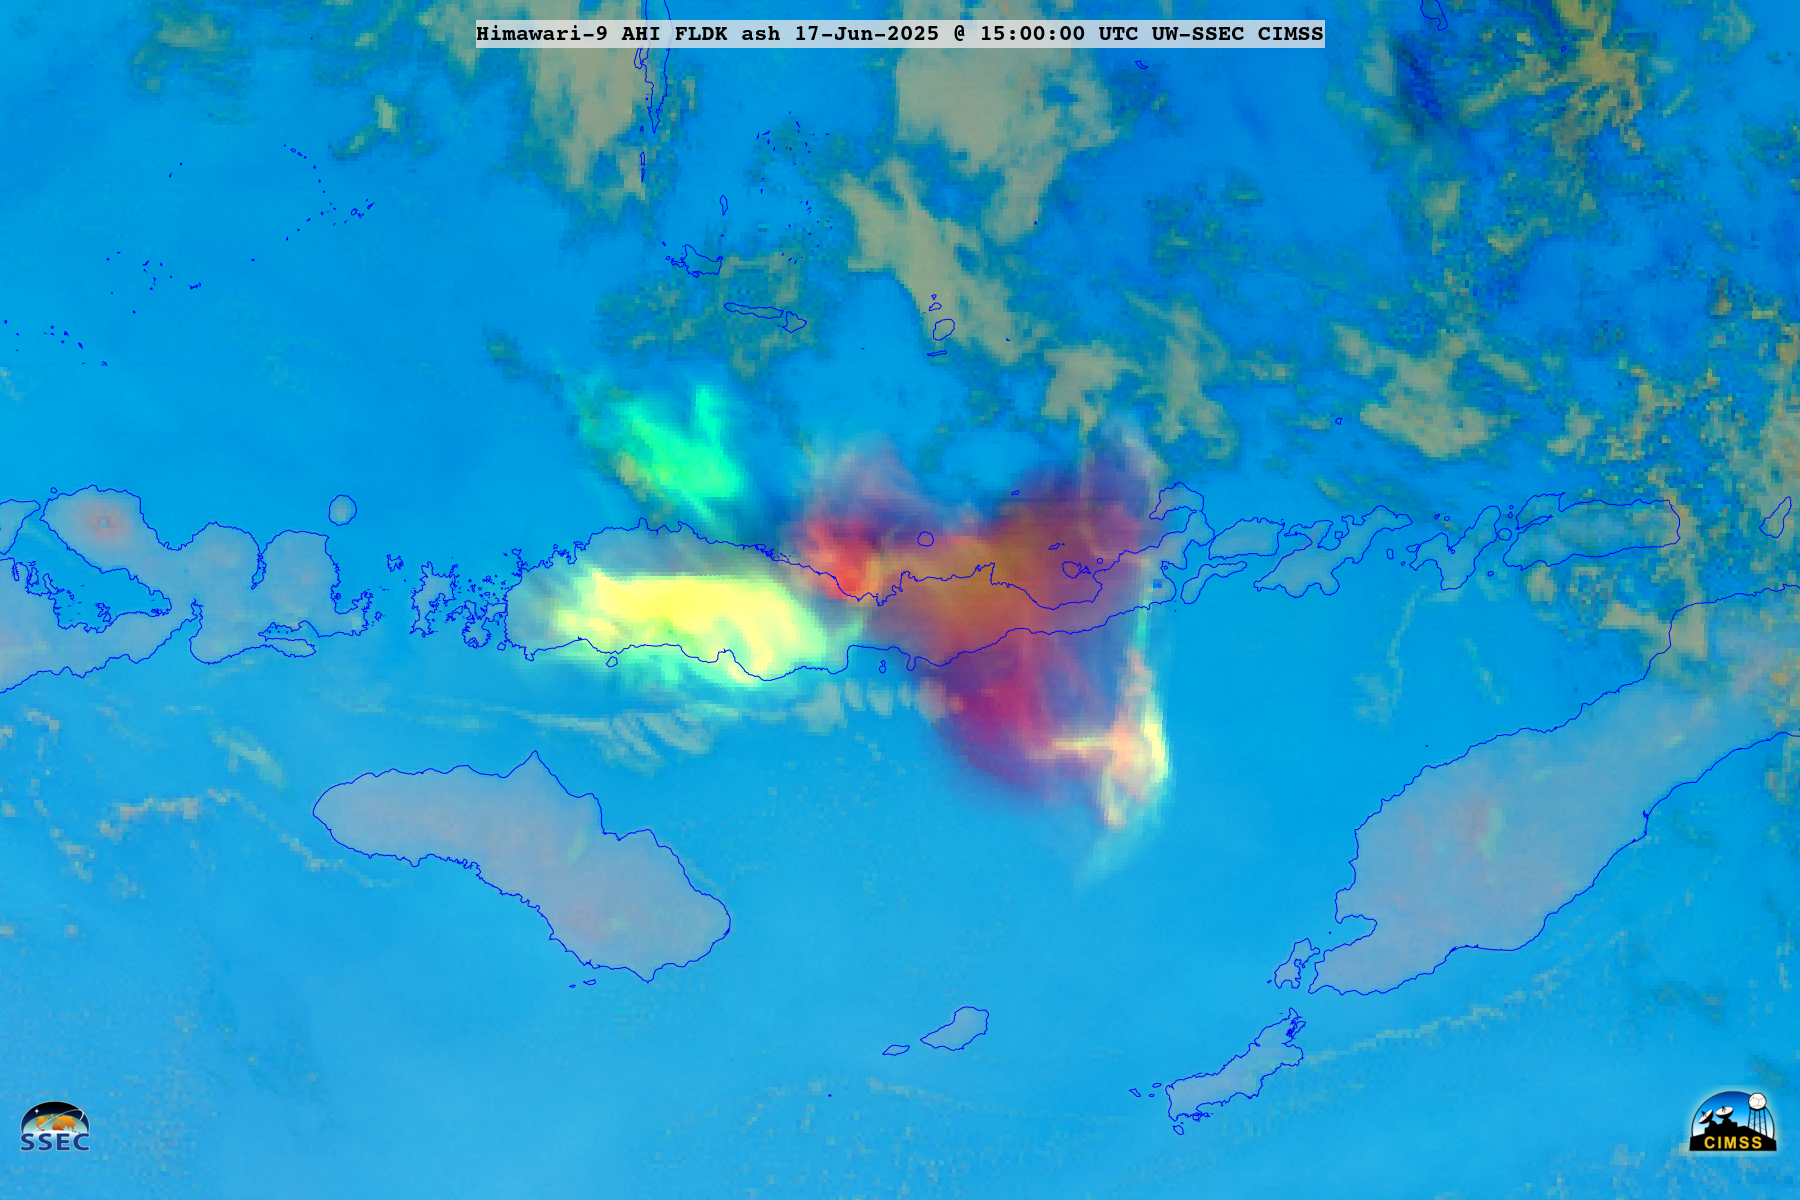
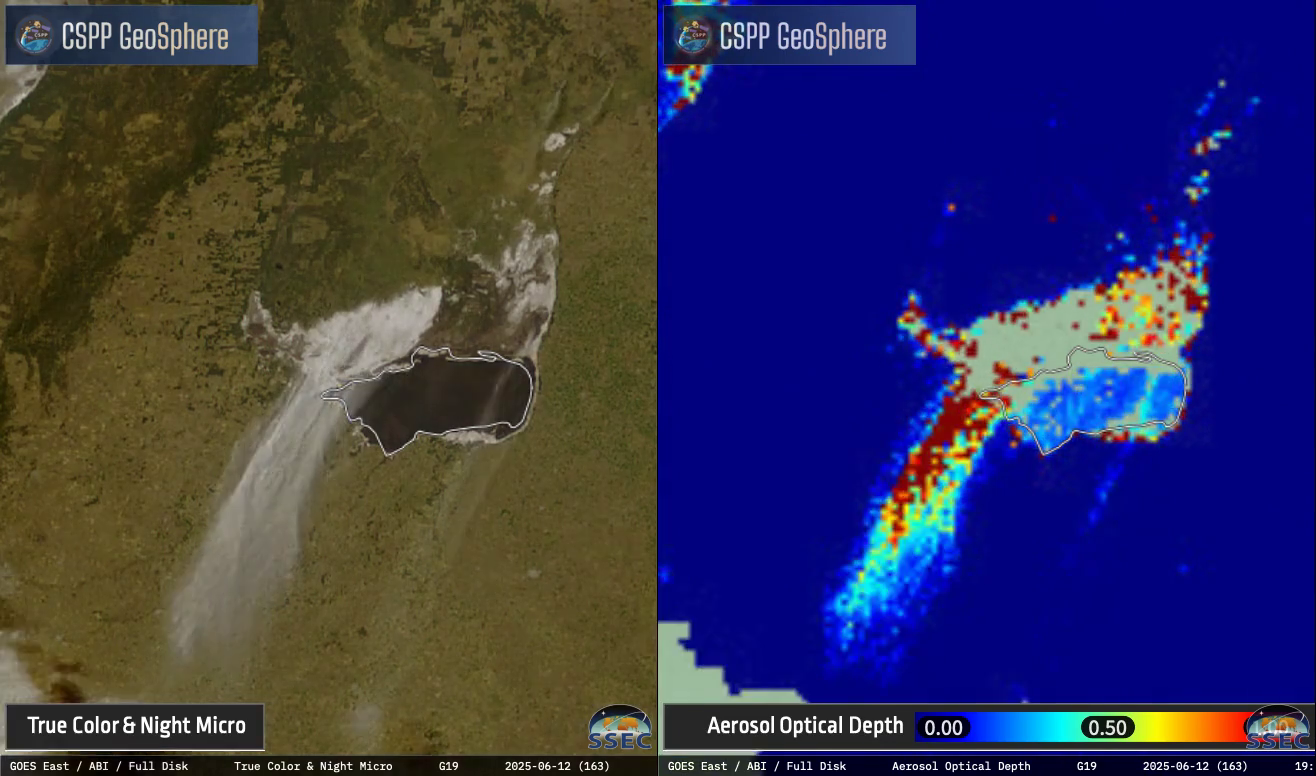
CIMSS Satellite Blog Updates: The Cooperative Institute for Meteorological Satellite Studies (CIMSS) Satellite Blog (https://cimss.ssec.wisc.edu/satellite-blog/) was updated with the following posts: "Blowing dust in Argentina" (Jun. 12), "Trout Fire in New Mexico produces a pyrocumulonimbus cloud" (Jun. 14), "Eruption of Lewotobi Laki-laki in Indonesia" (Jun. 17) and "Hurricane Erick makes landfall along the southern coast of Mexico" (Jun. 19). (S. Bachmeier, CIMSS)
 (Click image to enlarge)
Figure: Himawari-9 Ash RGB image showing the volcanic cloud -- composed of primarily ash (shades of red), SO2 (shades of green) or an ash/SO2 mixture (shades of yellow) -- following an eruption of Lewotobi Laki-laki in Indonesia on June 17, 2025.
 (Click image to enlarge)
Figure: GOES-19 True Color RGB (left) and Aerosol Optical Depth (right) showing a plume of blowing dust originating from salt flats north of Laguna Mar Chiquita in Argentina on June 12, 2025.
PUBLICATIONS:
OTHER:
| Archived Weeklies Page | Submit a report item |