[ Archive ]
| CIMSS-NOAA Weekly Report [ Archive ] |
CIMSS-NOAA WEEKLY HIGHLIGHTS FOR THE WEEK ENDING MAY 1, 2026
DATA, INFORMATION, AND USE-INSPIRED SCIENCE:
NOAA/CIMSS LightningCast at the Hazardous Weather Testbed: The NOAA/Cooperative Institute for Meteorological Satellite Studies (CIMSS) LightningCast AI model predicts the probability of lightning in the next hour. LightningCast version 2, which incorporates radar data alongside GOES-R data, is being evaluated at the Hazardous Weather Testbed (HWT) this spring. LightningCast "super dashboards" are also being evaluated by NWS forecasters, which display LightningCast probabilities and observed lightning trends from the Geostationary Lightning Mapper. LightningCast is meant to provide forecasters with enhanced guidance for their decision-support services. (J Cintineo, NOAA/NSSL; L. Heuscher, CIMSS; J. Sieglaff, CIMSS, V. Rajendran, CIMSS; M. Pavolonis, NOAA/NESDIS).
 (Click image to enlarge)
Figure: Example of the LightningCast "super" dashboard localized to the Lake Charles, LA, NWS office. Each panel plots LightningCast v1 and v2 probabilities (for comparison purposes) and GLM-observed flash counts.
 (Click image to enlarge)
Figure: An experimental public graphic from an HWT forecaster highlighting lightning potential using LightningCast guidance.
PEOPLE, AWARDS AND RECOGNITION:
TRAVEL AND MEETINGS:
TRAINING AND EDUCATION:
MEDIA INTERACTIONS AND REQUESTS:
SOCIAL MEDIA AND BLOG Posts:
CIMSS Satellite Blog Updates: The Cooperative Institute for Meteorological Satellite Studies (CIMSS) Satellite Blog was updated with the following posts: "Strong Tornadoes Impact Great Plains" (Apr. 24), "Fog/stratus over Lake Michigan" (Apr. 25), "30-second GOES-19 images of severe thunderstorms in the St. Louis area" (Apr. 27) and "Sparks Fire in eastern New Mexico" (Apr. 28). (S. Bachmeier, T. Wagner, CIMSS, 608-890-1980)
 (Click image to enlarge)
Figure: GOES-19 Infrared Window image with an overlay of GLM Flash Points at 0110 UTC on 24 April 2026 -- showing the severe thunderstorm in north-central Oklahoma 1 minute before it produced the EF4-rated tornado that moved through the southern part of Enid.
 (Click image to enlarge)
Figure: GOES-19 GeoColor RGB image with an overlay of NGFS Fire Detection polygons at 2350 UTC on 28 April 2026 - showing the thermal signature, smoke plume and dark burn scar associated with the Sparks Fire in eastern New Mexico.
PUBLICATIONS:
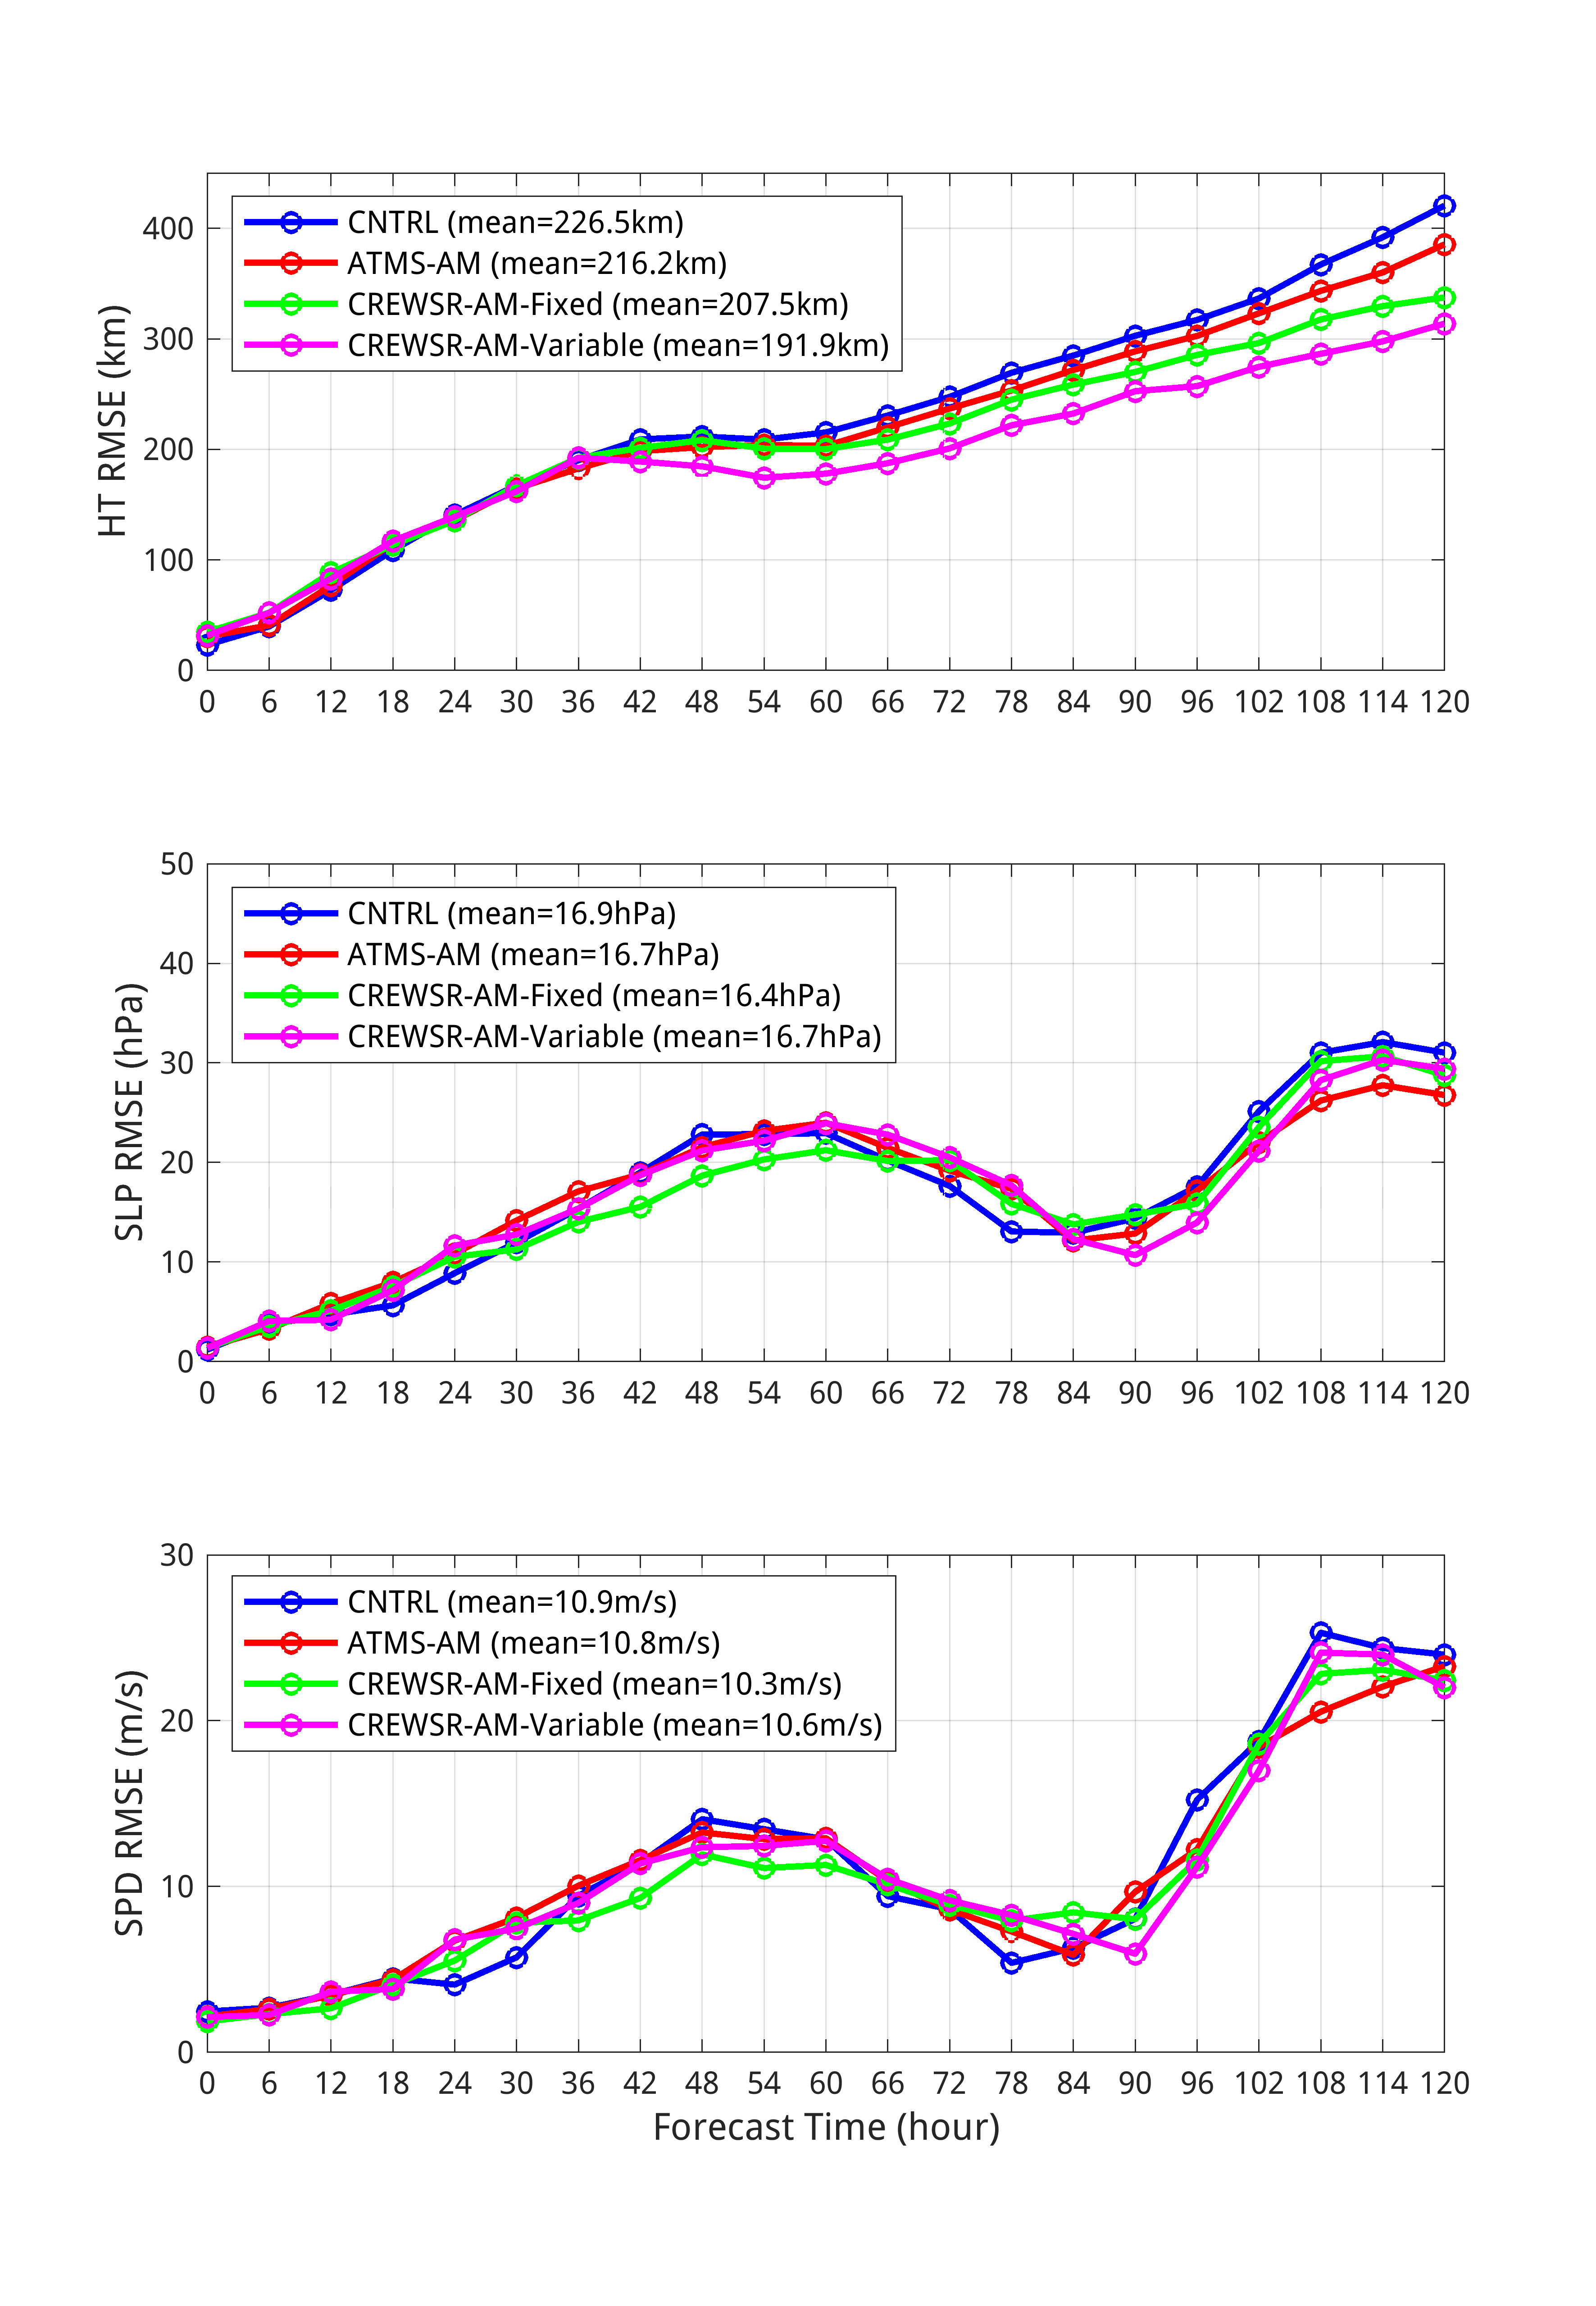
Paper on CREWSR OSSE studies published in JTech: A manuscript titled "The Added Value from the Configurable Reflectarray for Electronic Wideband Scanning Radiometry for Hurricane Ian (2022) Forecast via a Hybrid Observing System Simulation Experiment," authored by Pei Wang et al., was published in the Journal of Atmospheric and Oceanic Technology. This study uses a hybrid observing system simulation experiment (OSSE) to quantify the potential added value of the Configurable Reflectarray for Electronic Wideband Scanning Radiometry (CREWSR), a future microwave imaging and sounding sensor, on Hurricane Ian forecasts. With its high configurability, CREWSR can optimize sampling by increasing observations in data sensitive regions. A regional hybrid OSSE study shows that assimilating both CREWSR and ATMS radiances in the early morning orbit improves the track and intensity forecasts for Hurricane Ian. Furthermore, finer spatial resolution further improves forecast accuracy. Most importantly, CREWSR radiances using an optimized observing strategy yielded the greatest improvements. These results demonstrate that CREWSR has the potential to advance hurricane forecasting beyond the capabilities of current sensors. The citation is Wang, P., Z. Li, W. Blackwell, J. Li, T. J. Schmit, F. W. Nagle, L. Cucurull, and L. Lin, 2026: The Added Value from the Configurable Reflectarray for Electronic Wideband Scanning Radiometry for Hurricane Ian (2022) Forecast via a Hybrid Observing System Simulation Experiment. J. Atmos. Oceanic Technol., 43, 509–525, https://doi.org/10.1175/JTECH-D-25-0070.1. (Z. Li, CIMSS, 608-890-1982)
 (Click image to enlarge)
Figure: The 120-h forecast RMSE of (top) track, (middle) minimum SLP, and (bottom) maximum SPD from CNTRL, ATMS-AM, CREWSR-AM-Fixed, and CREWSR-AM-Variable for Hurricane Ian (2022). The numbers in the parentheses show the mean RMSE value of the 120-h forecasts.
OTHER:
| Archived Weeklies Page | Submit a report item |