[ Archive ]
| CIMSS-NOAA Weekly Report [ Archive ] |
CIMSS-NOAA WEEKLY HIGHLIGHTS FOR THE WEEK ENDING AUGUST 15, 2025
DATA, INFORMATION, AND USE-INSPIRED SCIENCE:
CIMSS Reports GOES-18 ABI Anomaly to CWG: Researchers at the Cooperative Institute for Meteorological Satellite Studies noticed an unusual, short-lived anomaly with GOES-18 ABI on August 1st, 2025. There was an interruption in data flow during the 1:40 UTC timeline, later determined to most likely be caused by storms near Wallops Island, that was first discovered by the Next Generation Fire System (NGFS) science team when data resumed during the 1:50 UTC timeline. The primary fire detection band on ABI (band 7, 3.9um) was the band most severely affected for one Full Disk and two CONUS frames after data flow resumed. CIMSS researchers presented this to the GOES-R Calibration Working Group (CWG) on August 6th; CWG investigated and quickly noted errors found in Kalman filter logs, calibration service logs, and Resampler logs. (M. Gunshor, CIMSS, 608-263-1146, C. Schmidt, CIMSS, 608-262-7973).
 (Click image to enlarge)
Figure: GOES-18 ABI Band 07 (3.9um) CONUS zoomed in over the western US on 1 August 2025 at 1:51 UTC. Issues with GOES-18 data collection minutes prior to this caused similar problems with missing data in multiple bands, though only band 7 had this blurring of the data possibly caused by repeating lines.
CIMSS conducts GeoXO sounder 4D information content analysis: Rodgers’ thermodynamic sounding information content analysis theory has been extended from one-dimensional (1D—vertical or spectral only) to four-dimensional (4D), incorporating horizontal and temporal dimensions to provide a more comprehensive understanding of an instrument’s overall sounding capability. Compared with 1D, 4D analysis is more complex because spatial and temporal correlations in the background error covariance matrix reduce the total information content. This extended method enables scientific quantification of the 4D information content for both geostationary and low Earth orbiting (LEO) sounders. As shown in the figure, the GeoXO sounder’s total information content increase factors exceed 250, 190, and 110 when compared with single-, two-, and three-orbit LEO sounder configurations, respectively. These results indicate that a single GeoXO sounder will have more than 190 times the resolving power for thermodynamic fields compared to the current LEO observing system with 2 orbits. In practical terms, for the same area and time period, one GeoXO sounder can deliver over 190 times more high-quality profile observations than the current LEO system. This significant increase in observation numbers enables far more effective characterization of atmospheric thermodynamic fields, allowing forecasters to better resolve spatial and temporal variations in moisture and instability—critically important for predicting the outbreak and development of short-lived severe storms. The 4D information content analysis method is also applicable to other instruments, such as microwave sounders. (Z. Li, CIMSS, 608-890-1982)
 (Click image to enlarge)
Figure: The information content increase factor for temperature (T) and moisture (Q) of the GeoXO sounder over the continental United States with an average footprint size of 5km and revisit time of 15 minutes compared to one orbit (CrIS), two orbits (IASI+CrIS), and three orbits (CrIS+IASI+CrIS). There are two satellites in each orbit, separated by 50 minutes, just like the JPSS and Metop series. The numbers in the brackets indicate the equator crossing time.
Interactive GOES Mesoscale Sector Planner Website at UW CIMSS: The Satellite Data Services team, in support of the Cooperative Institute for Meteorological Satellite Studies (CIMSS) at the Space Science and Engineering Center (SSEC), created a web page for visualizing mesoscale coverages for GOES East and West. Being able to visualize, compare, and plot hypothetical mesoscale locations helps with deciding where to aim future mesoscale coverages. On this web page, users can create multiple mesoscale locations and move them around on a full disk image of GOES data from within the past 30 minutes. To make things user-friendly, there are multiple ways of moving the mesoscale locations around. There is also an option to toggle a map overlay to help identify where the mesoscale coverages are in relation to geopolitical boundaries. Users are able to share links to and download PNG images of their custom mesoscale layouts. Primary users are NWS forecasters and NOAA research/testbed teams, and potentially emergency-management partners. Especially useful are the shareable URLs and near-real-time images which promote efficient interdepartmental coordination during planning. https://qcweb.ssec.wisc.edu/web/composites_viewer/#view:meso_estimator; (C. Suplinski, SSEC, 608-263-0225, M. Gunshor, CIMSS, 608-263-1146, J. Robaidek, SSEC, 608-262-6025 )
 (Click image to enlarge)
Figure: Screenshot of the new Mesoscale Estimator web site for visualizing mesoscale coverages. On display is a layout of 3 mesoscale locations: one over Wisconsin, one over Bermuda, and one over Florida. The imagery in this plot is from GOES-18 band 13 for August 14, 2025 16:50 UTC.
PEOPLE, AWARDS AND RECOGNITION:
TRAVEL AND MEETINGS:
TRAINING AND EDUCATION:
CIMSS Hosts High School Students for Online Weather Camp: The Cooperative Institute for Meteorological Satellite Studies hosted 53 high school students for the online CIMSS Weather Camp August 4-8, 2025. Students learned about research in Antarctica, hurricanes, severe weather and weather satellites as well as hearing from invited speakers about careers in meteorology. Guest speakers included Emma Hietpas of WKOW TV, Dr. Mayra Oyola from the University of Wisconsin–Madison Atmospheric and Oceanic Sciences Department and Dr. Joe Munchak from Tomorrow.io. NOAA scientist John Cintineo gave a talk on the use of AI for forecasting severe thunderstorms. Throughout the week the students studied weather maps in preparation for a forecast exercise for a chosen city (Minot, ND). The camp ended with each student presenting a short talk on their favorite weather subject. Derrick Herndon served as director for the camp leading the daily discussions with Maria Vasys (Outreach Specialist) providing support. (D. Herndon, CIMSS, 608-262-6741)
MEDIA INTERACTIONS AND REQUESTS:
SOCIAL MEDIA AND BLOG Posts:
CIMSS Satellite Blog Updates: The Cooperative Institute for Meteorological Satellite Studies (CIMSS) Satellite Blog (https://cimss.ssec.wisc.edu/satellite-blog/) was updated with the following posts: "Midwest Air Clearing Out, but Smoke Headed Northeast" (Aug. 8), "Significant flash flooding in the Milwaukee metro area — and 2 hikers injured by a lightning strike near Palmyra, Wisconsin" (Aug. 10), "GOES-19 signature of the EUMETSAT Metop-SGA1 launch" (Aug. 12) and "So long, NOAA-19" Aug. 13). (S. Bachmeier, D. Schumacher, T. Wagner, CIMSS, 608-890-1980)
 (Click image to enlarge)
Figure: NOAA-19 MiRS AMSU-A/MHS Rain Rate derived product over eastern North America at 1556 UTC on 10 August 2025.
 (Click image to enlarge)
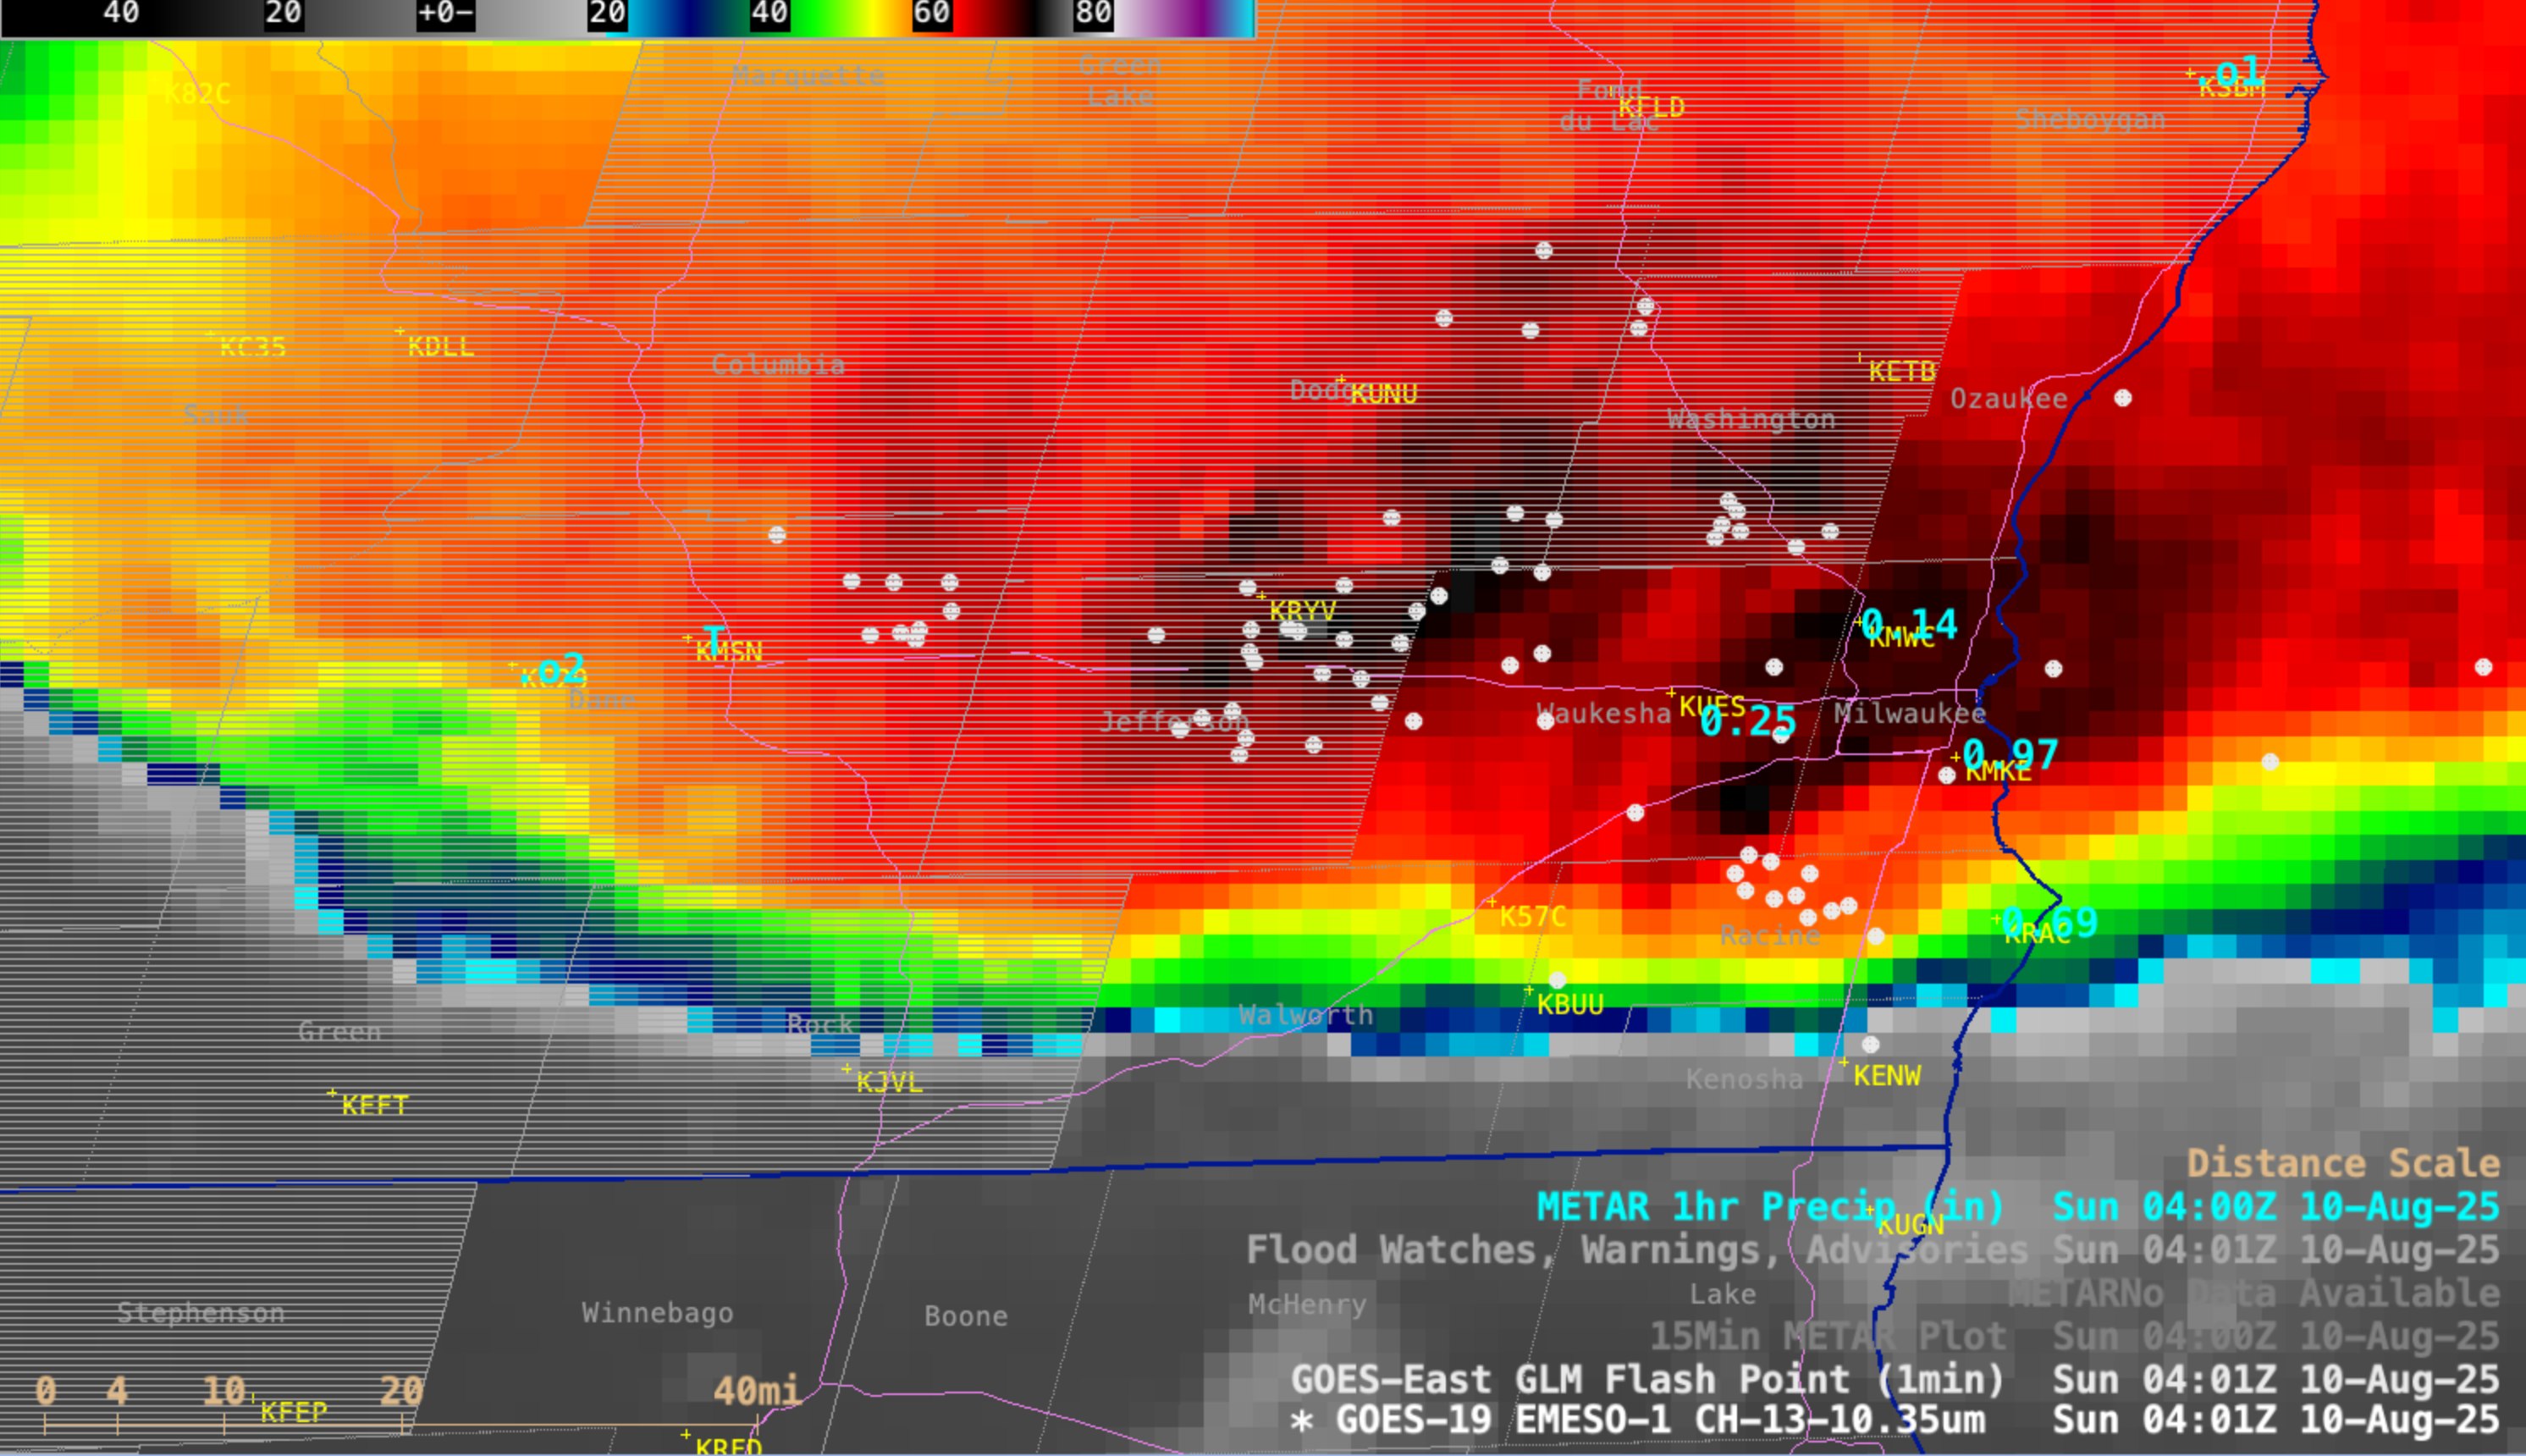
Figure: GOES-19 Infrared image with plots of GLM Flash Points (white) and 1-hour Precipitation amounts (cyan) over southeast Wisconsin and the Milwaukee metro area at 0401 UTC on 10 August 2025.
PUBLICATIONS:
OTHER:
| Archived Weeklies Page | Submit a report item |