Feeding 10 billion people
The FAO (Food and Agriculture Organization of the United Nations) estimates the number of undernourished people in the world at over 840 million – mostly living in developing countries of the Asian-Pacific and sub-Saharan Africa regions. Above all other goals that are the focus of international cooperation among countries, the eradication of famine might be considered to be the most universally supported. The United Nations Millennium Declaration, adopted by the world’s leaders at the Millennium Summit of the United Nations in 2000, captured the aspirations of the international community for the new century. It spoke of a world united by common values and striving with renewed determination to achieve decent standards of living for every man, woman and child. The first of the eight agreed ‘Millennium Development Goals’ is to “Eradicate extreme poverty and hunger” – with the specific target of reducing by half the number of undernourished people by 2015.
.jpg)
Countries facing food emergencies, Oct 2004
.jpg)
Number of undernourished people in developing countries, by region
FAO statistics suggest that some progress is being made towards this target – with the global incidence of malnourishment being reduced from 28% in the early 1980s to 17% in the early 2000s. However, as a result of global population growth, the decline in actual numbers of undernourished people has been slower; and the decline appears to have slowed in recent years. Malnutrition, and even starvation, will therefore remain a fact of life, and death, for hundreds of millions of people on Earth for the foreseeable future.
The challenge of sustainable food production is heightened by the expected global population expansion – increasing from around six billion to between nine and ten billion people by 2050. To meet the associated food demand, crop yields will need to increase, consistently, by over 2% every year through this period. Despite advances in technology, increasing food production must lead to intensification of agriculture in areas that are already cropped, and conversion of forests and grasslands into cropping systems. Much of the latter will occur in semi-arid regions and on lands that are marginally suitable for cultivation, increasing the risk of soil erosion, accelerated water use, and further land degradation. The resulting land-use changes are anticipated to make agriculture one of the most significant components of global change over the next century.
Information needs
Global agricultural production systems must be enhanced, well maintained, and reliable if we are to routinely meet the food requirements of the Earth’s projected 10 billion inhabitants beyond 2050 – and sustainable development practices, consistent with protection of biodiversity and ecosystems, are seen as the key. Such practices require a broad range of information on all scales. Parameters of importance include:
- land-cover, land-use, and vegetation state;
- crop yield, land degradation, and desertification;
- soil characteristics such as fertility and moisture levels;
- freshwater availability including from rainfall, fluxes in small water bodies, and groundwater resources;
- total irrigated area;
- population distribution, production intensity, and food provision.
This data is required at various (from local to global) scales and requires fusion of multiple datasets quantifying both the physical state of the land and socio-economic parameters. Such information will help provide food producers with: information on changes in land usage and productivity, improved market supply and demand forecasts, and seasonal and inter-annual action plans - taking account of seasonal forecasts and predictions of major climatic events such as El Niño.
.jpg)
The hope is that, with more detailed and timely information available on the state of crops and their growing environment, parties in the agricultural sector will improve their capacity to make informed decisions regarding sustainable agricultural practices:
- improving yields and increasing food security, by reducing susceptibility to climatic variations, extreme weather events and natural hazards; whilst
- making optimum use of the precious natural resources required to produce food, and protecting ecosystems and biodiversity;
so that the needs of present and future generations can be addressed.
The role of Earth observation satellites
In 2005, Earth observation satellites are in routine use for a broad range of agricultural applications.
In developed countries, where producers are often sophisticated users of agricultural and meteorological information, satellite data is widely used in many “agri-business” applications. Remote sensing techniques play an important role in crop identification, acreage and production estimation, disease and stress detection, soil and water resources characterisation, and also provide inputs for crop-yield and crop-weather models, integrated pest management, watershed management, and agro-meteorological services.
Multi-spectral imagery from the Landsat and SPOT satellite series might be regarded as the most widely exploited data for agricultural applications over the last few decades. By providing frequent, site-specific insights into crop conditions throughout the growing season, such satellite data products have helped growers and other agriculture professionals to efficiently manage crop production risks, thereby increasing crop yields while minimising environmental impacts.
With the advent of high accuracy global satellite navigation systems (such as GPS and Galileo) installed on farm machinery, new capabilities are being developed which allow the possibility of automated operations like tillage, planting, fertilizer applications, pesticide/herbicide spraying, irrigation, harvesting and other mechanised cultural operations – all optimized with the aid of geo-spatial information provided by imaging satellites.
The latest generation of multi-spectral, hyper-spectral, and synthetic aperture radar (SAR) sensors – combined with improved models for interpretation of their data for various crops and environmental parameters – are increasing the scope and capabilities of Earth observing satellites in support of agricultural businesses. A number of commercial satellite missions (e.g. RapidEye (Germany) and Tuyuan (China)), dedicated exclusively to (and funded by) crop monitoring and yield forecasting, will be launched within the next 3 years – and a sizable industry of service companies is emerging to exploit such missions.
.jpg)
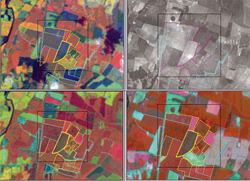
China’s State Food Bureau has developed an “agriculture information monitoring system” using several Earth observation satellite data sources
.jpg)
.jpg)
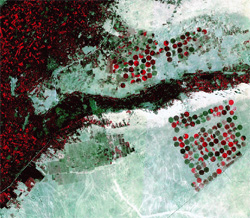
Radar imagery is used to classify rice fields in Thailand and to provide simple estimates of acreage
Earth observation data is also used by government agencies in developed countries, typically on large scales – in support of market forecasting, generation of statistics, and in development and enforcement of agricultural policies, including in relation to the payment of subsidies to farmers for growing (or not growing) certain crops. (See the article on the MARS programme of the European Commission.)
In developing countries, government agencies and international organisations – with responsibility for advice on development decisions and for food security – are exploiting Earth observation data as a management tool in decision-making processes. For example, the government of India has been actively exploring the use of spaceborne remote sensing data for crop acreage estimation and production since the early 1980s. These projects have been expanded to provide national level forecasts – including through use of all-weather microwave data (from synthetic aperture radar sensors such as RADARSAT) for monitoring of rice crops in the cloudy and wet monsoon season.
Similar state-funded projects are underway in China. China is a large country with 1.2 billion people and a per capita cultivated land area of just one third of the world average. Grain production is a national priority for agricultural development, and is an important influence on China’s sustainable development, modernisation, and food security for the population. The government needs timely and accurate grain production information for agricultural management and market decision making. Remote sensing techniques play an important role in crop identification, acreage and production estimation, disease and stress detection, soil and water resources characterisation, and also provide inputs for crop-yield and crop-weather models, integrated pest management, watershed management, and agro-meteorological services.
.jpg) |
.jpg) |
| Rainfall estimates are derived from cold cloud duration maps such as this one from METEOSAT |
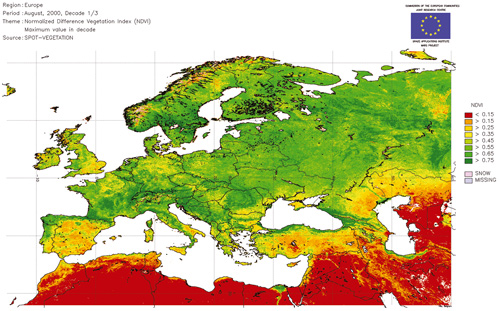
NDVI (vegetation) map as utilised by FAO |
FAO is a key player in establishing the link between Earth observation data and product suppliers and the communities of users at all levels. FAO has a well established and structured mechanism for interacting with farmers, national agencies, and international agencies. It also has direct cross links to work on ecosystems and biodiversity. FAO’s Global Information and Early Warning System (GIEWS) on Food and Agriculture collects data from four different satellite systems to monitor various crop seasons throughout the world:
- rainfall estimates are derived from cold cloud duration images of Africa (METEOSAT) and Asia (GMS); archives dating back to 1988 allow analysts to pinpoint anticipated droughts based on seasonal norms;
- Normalised Difference Vegetation Index (NDVI) products from the AVHRR sensor provide an indication of the vigour and extent of vegetation cover – and can help monitor crop conditions;
- the VEGETATION instrument on-board the SPOT-4 satellite provides data at 1km resolution – suitable for crop monitoring at sub-national levels.
One of the main causes of food insecurity is drought. FAO and other international bodies utilise satellite data sources operationally to help identify drought-prone areas, and then to monitor changing drought risks and conditions. Pests, too, are a major cause of food insecurity, particularly through their direct effects on crop yield and harvests (see the example on the 2004 locust plague in Africa).
Future challenges
Current Earth observation satellites have the capability to supply many agricultural information needs – for both developed and developing countries. In the case of developing countries, there is a need to ensure that those who might benefit most from this kind of information, are suitably equipped with the knowledge and equipment to effectively apply it for long-term benefit. This will require investment in capacity-building for training and infrastructure projects.
FAO report that the capacity to use Earth observation data is generally weakest in Africa and that sustainability of institution-building initiatives remains problematic. Needs highlighted by FAO include:
- increased co-ordination between national satellite programmes in developed countries and their counterpart development assistance programmes;
- stronger links between ground observations in developing countries and related satellite observations by developed countries;
- better understanding of developing country user needs for Earth observation data in the agricultural and rural sectors – more assessments are needed.
To ensure maximum value from the data in agricultural applications in both the developed and developing world, further attention must be paid to:
- improvements in product development, validation, and continuity of data sources, in particular of high (5m) and medium (30-40m) resolution satellite systems such as LANDSAT and SPOT;
- improved data archiving and access;
- integration of data collection, management, and assimilation;
- strengthened links between in-situ data gathering networks and satellite programmes to assist product validation such as land cover, land use, crop production, and cultivated area.
.jpg) |
.jpg) |
North-West Africa's locust plague of 2004
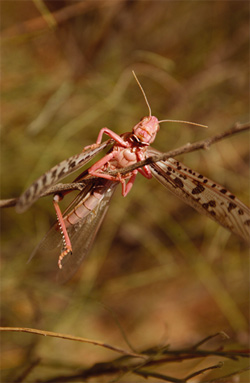
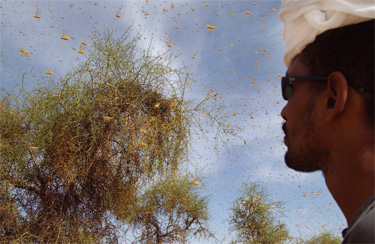
A wet winter and spring settled over north-western Africa in 2004 and the dry Sahel bloomed with life. As the desert turned green, the plentiful water nourished more than vegetation. Buried in the sandy soils were the eggs of desert locusts, waiting to absorb moisture and hatch. This year, there was enough water and vegetation to support large populations of young locusts and, by late summer, several large swarms had developed.
Swarms can contain as many as 80 million locusts per square kilometre and may cover several square kilometres. An adult locust can eat its own weight in food every day (about two grams) which means that, according to the FAO, a small part of a typical swarm can eat as much food as 2,500 people in a single day. At these rates, the locusts consume most vegetation in their path and then must migrate to find new sources of food.
The locust emergency in 2004 began as three separate outbreaks in 2003 in Mauritania, Mali, and Niger. While locusts can’t be seen in satellite imagery, the conditions that support them are clearly visible. The image shows how vegetation differed from previous years. The image is a composite of Normalized Difference Vegetation Index (NDVI) data collected between April 6 and April 13, 2004. Green areas indicate that there was more vegetation in the region than the average of the past four years. Not surprisingly, these areas correlate well with the early breeding grounds of the locusts near the interface between dry desert land and wetter coastal land.
The satellite data also shows where locust swarms can migrate to find food, by indicating where food is available. In the lower image, a composite of data collected between August 28 and September 4, 2004, pockets of green in southern Mauritania, Senegal, Mali, and Burkina Faso suggest where the locusts may be finding food and breeding. Information from FAO showed that these were indeed the areas where the locusts were concentrated at the time. Mauritania’s national food security authority expected to lose up to 75% of the cereal crop as a result of the plague.
|
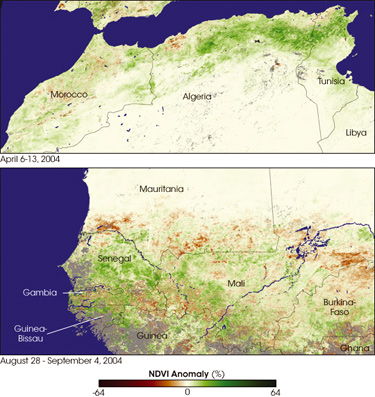
MODIS imagery was used to assist FAO’s Desert Locust Information Service predict migration paths of the 2004 plague in Africa |
|
 |
BACK TO TOP
|

.jpg)
.jpg)
.jpg)
.jpg)
.jpg)
.jpg)
.jpg)
.jpg)
.jpg)
.jpg)
.jpg)
.jpg)
.jpg)
