| Day/Time
new thres |
Pole/Satellite |
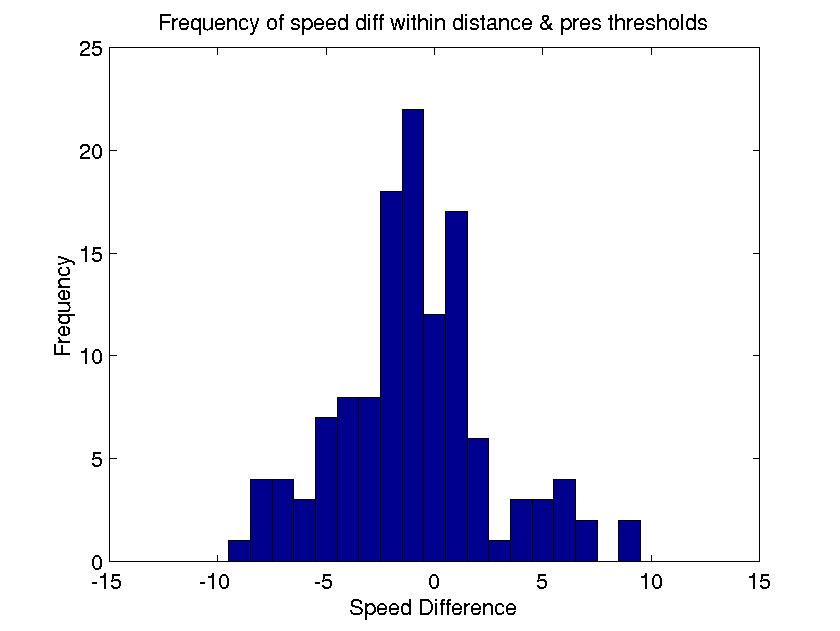
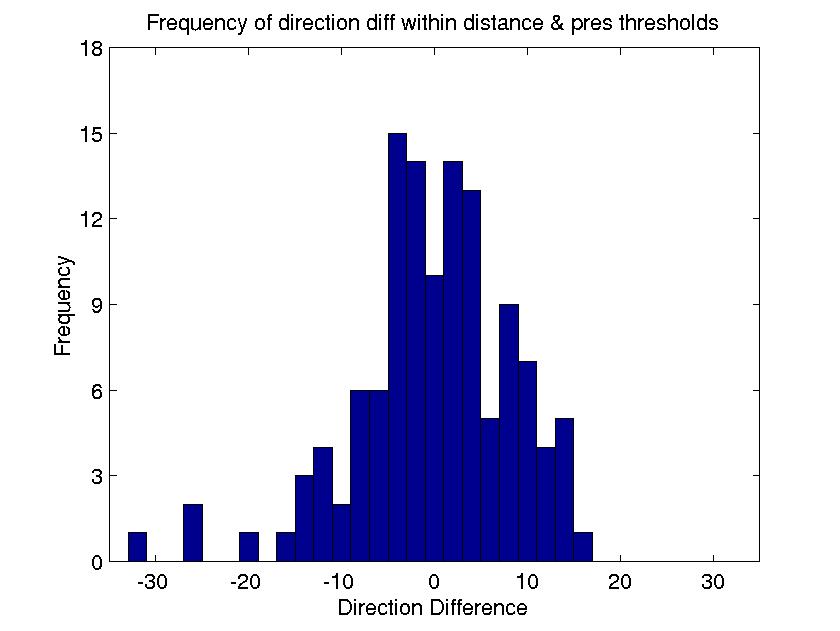
# of points within
thresholds |
speed rms (m/s) |
IR spd nrms |
direction rms |
mean dist diff |
mean pres diff |
mean spd diff |
mean dir diff |
153/0710
NP/TERRA
125
3.6
0.12
10.1
30.1
5.2
-0.5
| 0.2
| | | | | | | | | |
153/0850
NP/TERRA
84
4.1
0.26
14.3
29.3
11.3
-0.9
| -1.1
| | | | | | | | | |
153/1030
NP/TERRA
72
3.9
0.17
12.4
31.2
-1.7
1.5
| 3.3
| | | | | | | | | |
153/1205
75 km
NP/TERRA
78
149
2.9
3.6
0.18
--
11.0
13.4
28.5
--
7.1
--
0.2
--
| 2.0
--
| | | | | | | | | |
153/1345
50mb
NP/TERRA
278
471
3.9
4.1
0.19
--
12.4
11.9
29.3
--
5.2
--
0.3
--
| -1.2
--
| | | | | | | | | |
153/1230
NP/AQUA
154
3.8
--
13.4
30.5
2.9
-0.1
| 2.6
| | | | | | | | | |
153/1410
NP/AQUA
59
3.8
--
13.4
31.0
3.6
1.0
| 1.1
| | | | | | | | | |
154/0050
SP/AQUA
1538
3.8
0.21
13.4
30.3
-1.2
0.1
| -1.1
| | | | | | | | | |
154/0230
SP/AQUA
1753
3.7
0.19
12.9
30.1
0.4
0.0
| 0.1
| | | | | | | | | |
188/1730
Meteosat-7
1352
2.4
0.12
8.2
24.4
1.4
-0.2
| 0.1
| | | | | | | | | |
195/2245
GOES E
5591
2.6
0.19
9.7
26.6
1.0
-0.4
| 0.3
| | | | | | | | | |
| Day/Time
new thres |
Pole/Satellite |
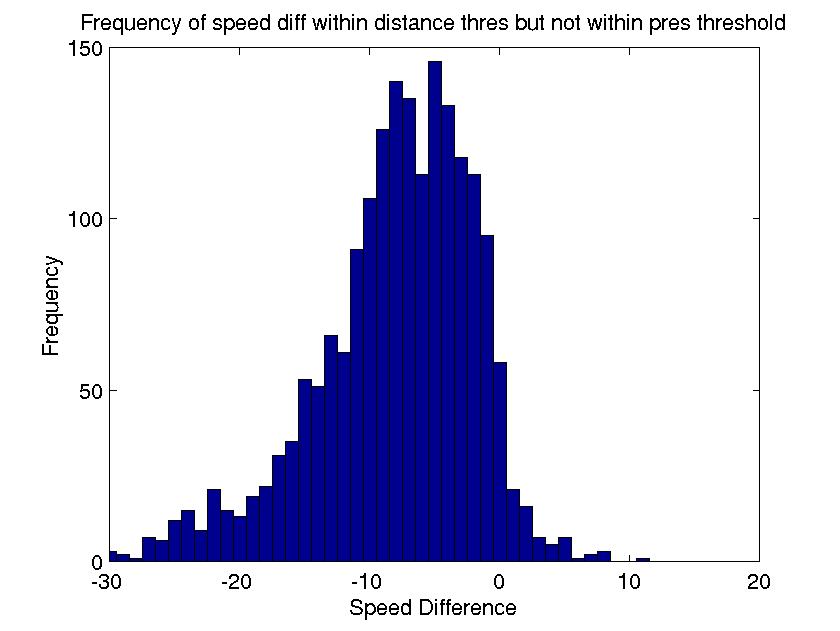
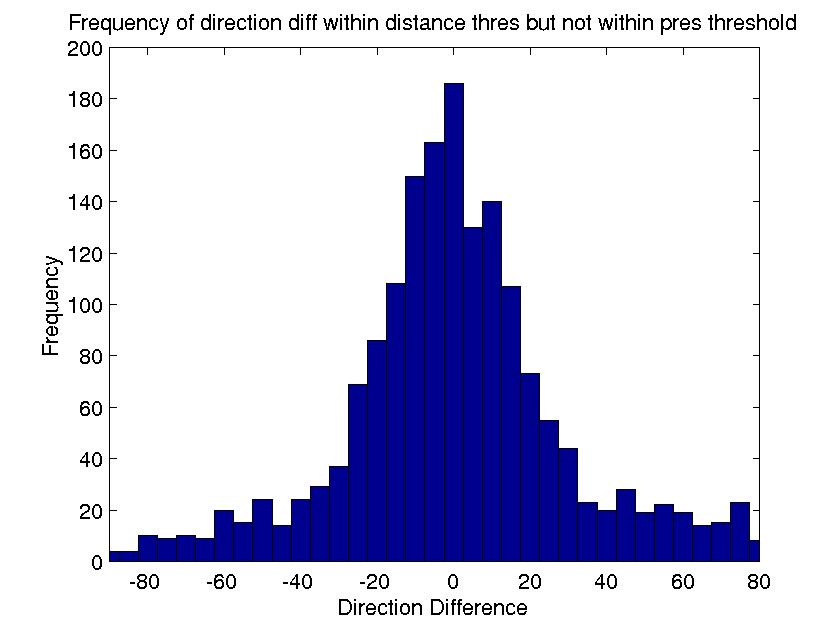
# of points within distance but
not within pressure threshold |
speed rms (m/s) |
direction rms |
153/0710
NP/TERRA
1882
9.8
| 49.8
| | | | |
153/0850
NP/TERRA
2131
7.5
| 38.5
| | | | |
153/1030
NP/TERRA
2711
6.5
| 33.1
| | | | |
153/1205
75 km
NP/TERRA
2087
4552
6.3
6.3
| 33.2
34.7
| | | | |
153/1345
50mb
NP/TERRA
2834
2641
7.8
8.0
| 30.6
31.5
| | | | |
153/1230
NP/AQUA
3027
8.7
| 20.8
| | | | |
153/1410
NP/AQUA
3566
8.2
| 25.0
| | | | |
154/0050
SP/AQUA
3984
5.1
| 17.0
| | | | |
154/0230
SP/AQUA
3206
5.2
| 20.1
| | | | |