The investigators are engaged not only in algorithm development, product generation, and validation; they also use the products for scientific discovery. The data have proven to be critical in the evaluation of trends and anomalies in sea ice extent and cloud cover, and have been instrumental in quantifying feedback processes and interactions within the climate system. Some examples are given here. For completeness, we include the research reported last year.
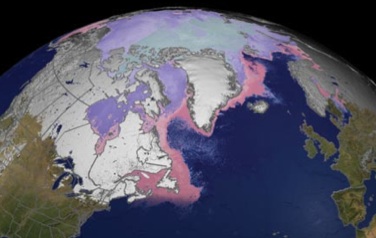
The ice age product continues to be used to study changes in Arctic sea ice thickness over time. (The analysis was supported by NASA.) Analysis of the record for 1980 through March 2011 (Maslanik et al., 2011) shows continued net decrease in multiyear ice coverage in the Arctic Ocean, with particularly extensive loss of the oldest ice types. The fraction of total ice extent made up of multiyear sea ice in March decreased from about 75% in the mid 1980s to 45% in 2011, while the proportion of the oldest ice declined from 50% of the multiyear ice pack to 10%. These losses in the oldest ice now extend into the central Arctic Ocean and adjacent to the Canadian Archipelago; areas where the ice cover was relatively stable prior to 2007 and where long-term survival of sea ice through summer is considered to be most likely. Following record-minimum multiyear ice coverage in summer 2008, the total multiyear ice extent has increased to amounts consistent with the negative trend from 2001-2006, with an increasing proportion of older ice types. This implies some ability of the ice pack to recover from extreme conditions. This recovery has been weakest in the Beaufort Sea and Canada Basin though, with multiyear ice coverage decreasing by 83% from 2002 to 2009 in the Canada Basin, and with more multiyear ice extent now lost in the Pacific sector than elsewhere in the Arctic Ocean.
The age product continues to be used in other ways as well. Two examples are given below. Figure 1 was used as part of the NSF-sponsored "Sea Ice Outlook" forecasting summary earlier this year, and Figure 2 was supplied to NASA aircraft mission planners to assist in flight line determination as part of the IceBridge project.
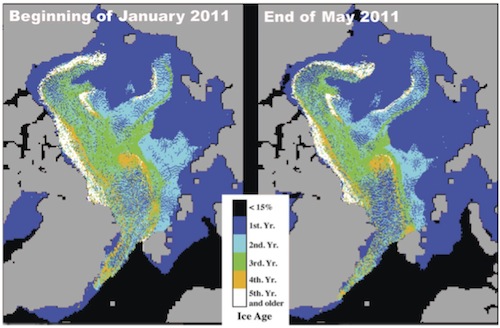
Fig. 1. Comparison of sea ice age coverage for January and May 2011.
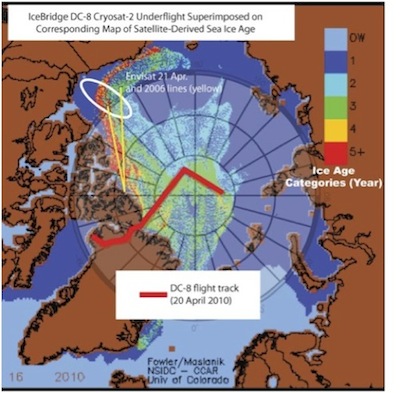
Fig. 2. An example use of the ice age product to help design flight plans for NASA IceBridge aircraft missions.
The APP-x product suite has been used extensively to determine trends in cloud cover and to quantify the relationships between clouds, sea ice, and surface temperature. The influence of trends in sea ice concentration (SIC) and cloud cover on trends in surface temperature over the Arctic Ocean from 1982 to 2004 was investigated analytically, and evaluated empirically with APP-x data. It was found that changes in SIC and cloud cover played major roles in the magnitude of recent Arctic surface temperature trends. Significant surface warming associated with sea ice loss was found over the Chukchi and Beaufort Seas in autumn, accounting for most of the observed warming trend. In winter, surface temperature trends associated with changes in cloud cover are negative over most of the Arctic Ocean, and with cloud cover trends explaining most of the surface temperature cooling. After eliminating the effects of changes in SIC and cloud cover on surface temperature trends, the residual surface temperature trends can be used in a more robust diagnosis of surface warming or cooling in the Arctic.
Extending the work described above, passive microwave sea ice concentration and MODIS (Moderate-resolution Imaging Spectroradiometer) cloud amount were combined to investigate Arctic cloud-sea ice feedbacks. The Arctic has been experiencing dramatic changes in both cloud characteristics and in sea ice extent and concentration, and one would expect the changes in the two may be related to some degree, given that clouds influence the surface energy budget, the presence of sea ice influences lower tropospheric moisture, and large scale horizontal fluxes of heat and moisture affect both ice and clouds. However, it is unclear how the changes in Arctic sea ice feed back on the clouds. Results of this study show that a 1% decrease in sea ice concentration corresponds to 0.14~0.34 percent increase in cloud amount in different seasons. This study also provides a tool to study feedback mechanisms in other components of the climate system.
An additional use made of the APP-x albedo product was as a comparison data set for albedo simulated using the NCAR “CICE” ice model component of the climate model CCSM3. Monthly means of albedo were compared to means generated by CICE. Results suggest no substantial problems in the CICE simulations (Blazey et al., 2010).
Observation based estimates of controls on the snow albedo feedback (SAF) are needed to constrain the snow and albedo parameterizations in general circulation model (GCM) projections of air temperature over the Northern Hemisphere (NH) landmass. Snow albedo and snow cover from APP-x were used to study controls on the NH SAF. The total SAF is the sum of the effect of temperature on surface albedo over snow covered surfaces (‘metamorphism’) and over surfaces transitioning from snow covered to snow free conditions (‘snow cover’). The North American spatial pattern of SAF is chiefly explained by the snow cover component but there is evidence that both snow cover and metamorphosis components contribute to the pattern of SAF over Eurasia. Anthropogenic deposition of impurities on central Eurasia snow covered surfaces may explain the distinction between the two continents.
The passive microwave sea ice concentration products are one of the primary indicators of the seasonal and interannual evolution of the ice cover. The data provide the basis for regular scientific analysis of conditions at the NASA and NOAA funded “NSIDC Arctic Sea Ice News and Analysis” (ASINA) website (http://nsidc.org/arcticseaicenews/). Data and imagery are provided by the NSIDC Sea Ice Index (http://nsidc.org/data/seaice_index/), originally developed through NOAA funding and now maintained by NOAA and NASA funding. The passive microwave sea ice products also provide input and a baseline for evaluation for the ARCUS/SEARCH Sea Ice Outlook (http://www.arcus.org/search/seaiceoutlook/). This project informally brings together several science groups to assess and project summer sea ice conditions. Several researchers on this product development team (Maslanik and Fowler, Meier, Stroeve) contributed projections based on passive microwave sea ice concentration and age data.
The Outlook and ASINA analyses, as well as research by other groups, suggest that the ice extent decline and thinning due to loss of older ice types are changing the character of the ice cover. The thinner ice cover is responding more dramatically to synoptic-scale variation both in the winter (i.e., late ice growth and a record late seasonal ice extent maximum during March 2010) and summer (more broken ice pack capable of being more easily compacted or dispersed).
The combination of several of the CDR time series documents the time evolution of albedo and ice melt ponds as a function of sea ice type. One outcome from this work is that albedo – its evolution throughout the melt season as well as the albedo values themselves – vary as a function of ice type (first-year vs. multiyear ice, and between different ages of multiyear ice). As noted earlier, this is significant given the shift in the Arctic ice cover toward a greater fraction of first-year ice. A second outcome is that the proportion of surface melt ponds (which appear as open water to passive microwave ice concentration algorithms) does not translate into an equivalent fractional error in the microwave concentrations. This is counter-intuitive, perhaps arising from the use of daily averaged brightness temperatures for concentration vs. orbit-specific APP-x data.